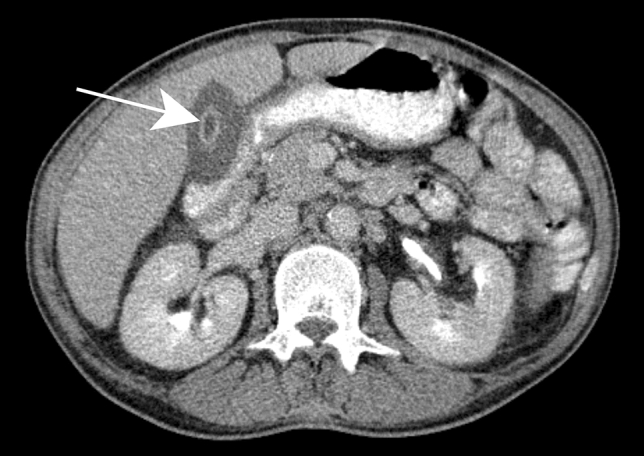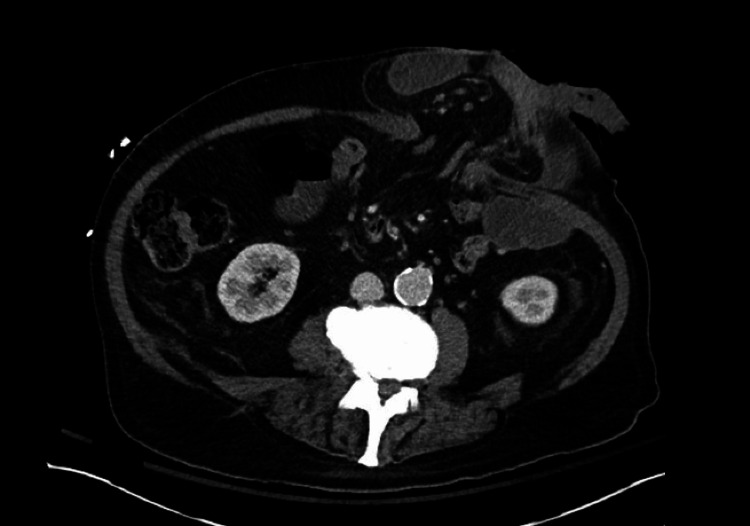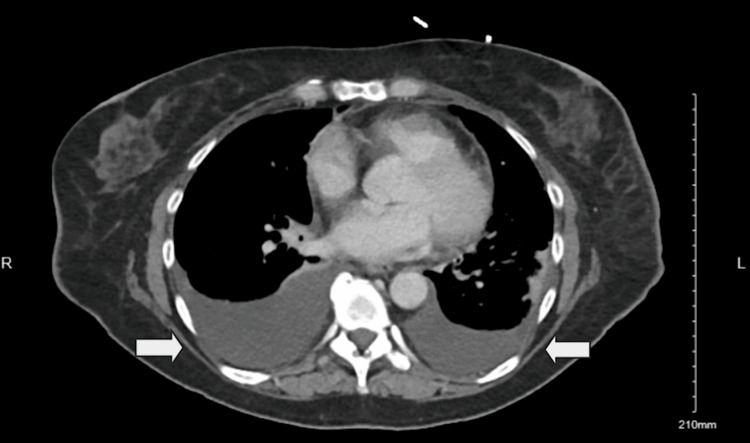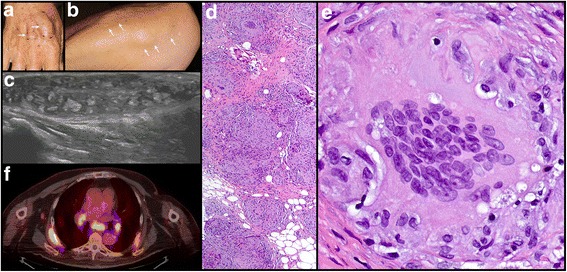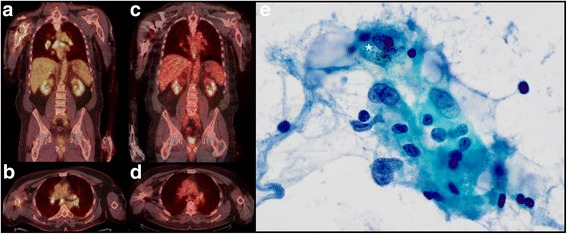
← OncoRx Imaging Guide
VISUAL REFERENCE · PROVENANCE & REUSE

Image sources & licences

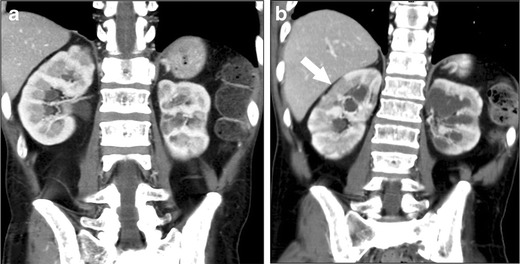
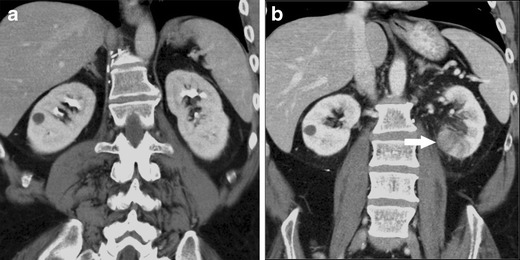
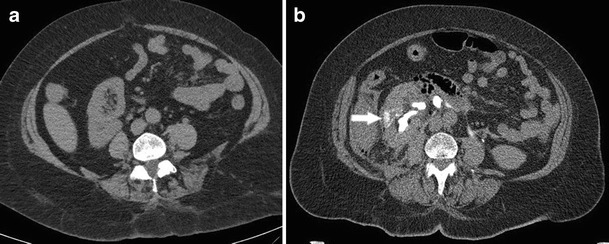
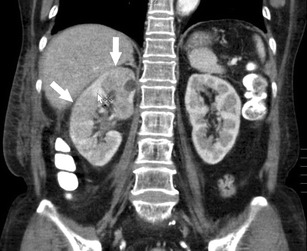
197 published figures supplement 144 cards. Only original published clinical material is used. Source cases, figures and clinical conditions are kept distinct; repeated views of one patient count as one case.

All published figures below retain the original panels and annotations. They are reproduced under the linked published reuse licence. The original case, treatment or combination is stated explicitly. A figure from another exposure illustrates a pattern only; it does not establish a new drug association. All clinical interpretation remains pending owner review.

This is a non-commercial educational reference. Each image keeps its own published reuse licence, author credit and source link. Images licensed for non-commercial use are reproduced unchanged. Copyright and licence terms remain with the original authors.

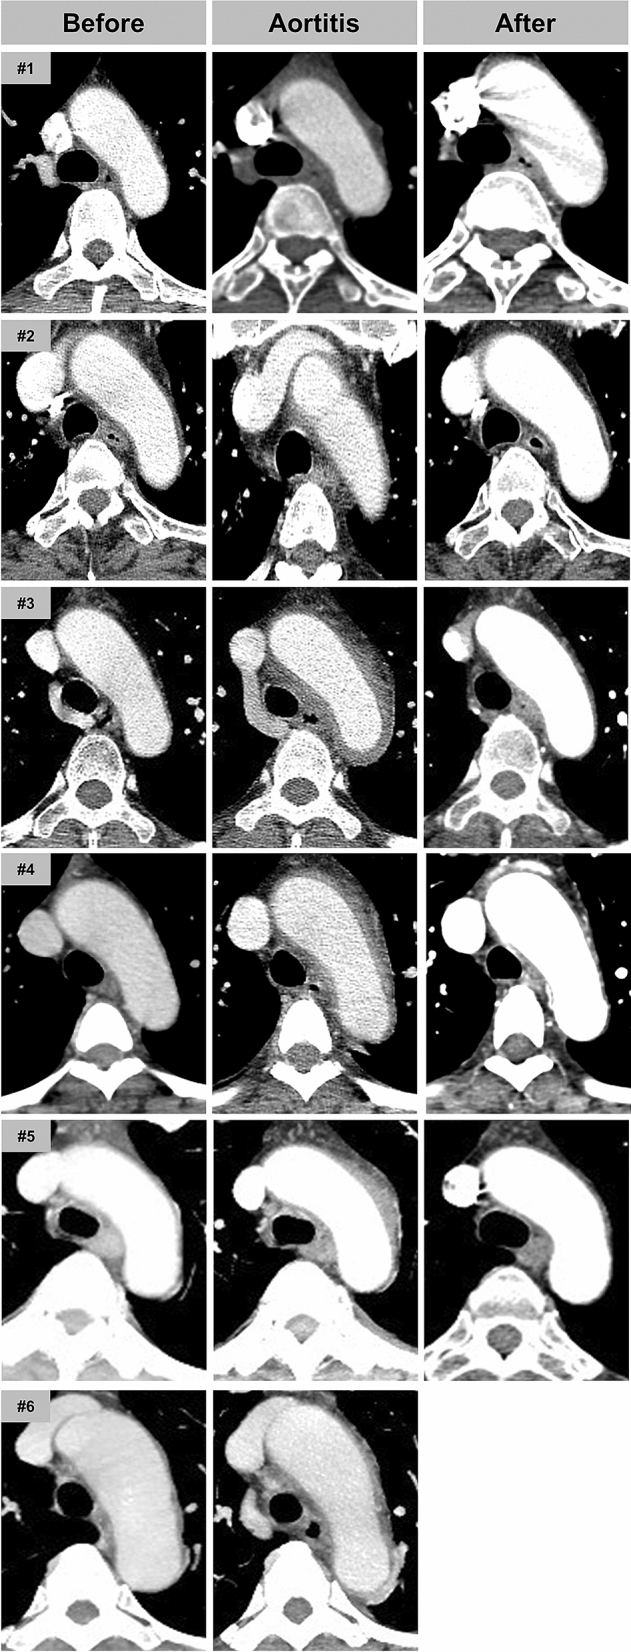
Serial aortic CT in six separately identified patients.
treatment example · Figure 1

Serial aortic CT in six separately identified patients.

Original context: Pegylated filgrastim during breast-cancer chemotherapy.

Rows identify cases 1–6. Pretreatment, active and follow-up columns repeat each case; Figure 2 contains the same patients, not new cases.

Lee Sang Yoon, Kim Eun Kyoung, Kim Ji-Yeon et al.. Sci Rep. 2020 Oct 29;10:18647. doi: 10.1038/s41598-020-75620-6. Figure 1.
The incidence and clinical features of PEGylated filgrastim-induced acute aortitis in patients with breast cancer

Original figure & article ↗ · CC BY 4.0 ↗

None. Original figure, unmodified; all published panels and annotations retained.

Used in: Aortic wall thickening after G-CSF

File provenance

Source: PubMed Central / U.S. National Library of Medicine. Retrieved 2026-10-28 Retrieved from the official PMC Open Access dataset. This stored copy may not include later source updates. No NLM endorsement.

SHA-256: e04d2ba69d5cc27cbbef75867e196f68477322bf1a53c67c295d7de151b8d644
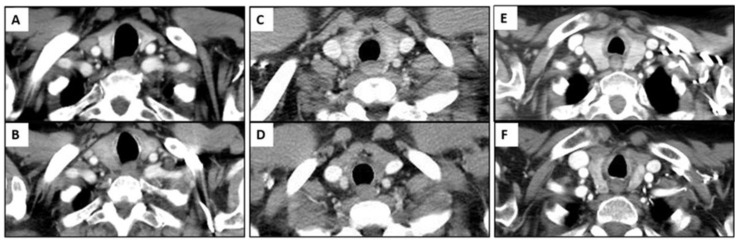
CT examples of thyroid enlargement, low attenuation and later atrophy.
treatment example · Figure 2

CT examples of thyroid enlargement, low attenuation and later atrophy.

Original context: Nivolumab or pembrolizumab, as identified in the original panels.

Park Hyesun, Hata Akinori, Hatabu Hiroto et al.. Cancers (Basel). 2023 Jan 20;15(3):649. doi: 10.3390/cancers15030649. Figure 2.
Immune-Related Thyroiditis in Patients with Advanced Lung Cancer Treated with Immune Checkpoint Inhibitors: Imaging Features and Clinical Implications

Original figure & article ↗ · CC BY 4.0 ↗

None. Original figure, unmodified; all published panels and annotations retained.

Used in: Checkpoint-associated thyroiditis

File provenance

Source: PubMed Central / U.S. National Library of Medicine. Retrieved 2026-10-28 Retrieved from the official PMC Open Access dataset. This stored copy may not include later source updates. No NLM endorsement.

SHA-256: 5b957f3870029ee57c59bc7c97bb34a538d607e235e4d50ce55e2a32a9d54e8d

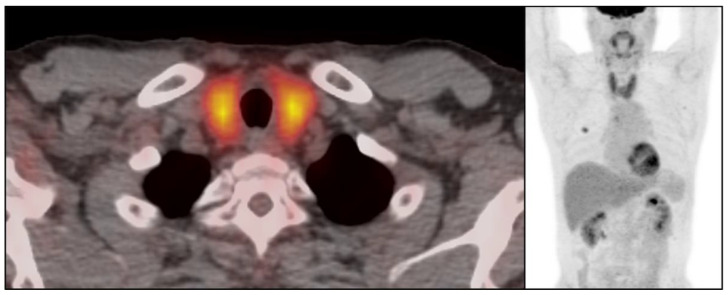
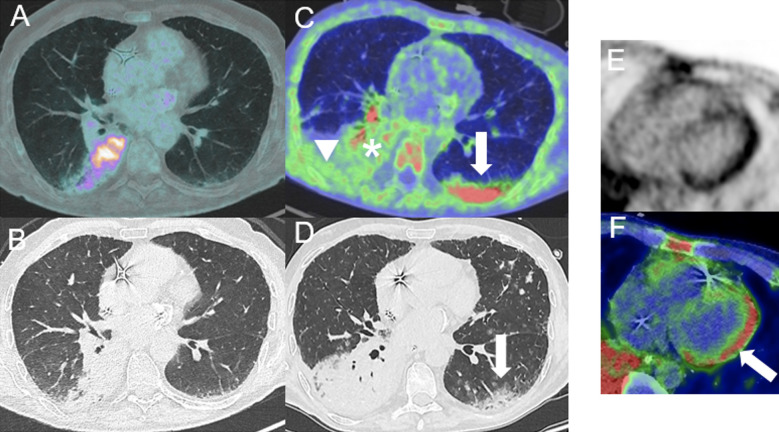
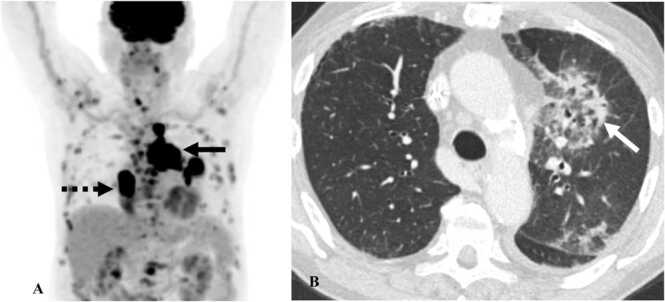
Diffuse thyroid FDG uptake in the published case.
treatment example · Figure 3

Diffuse thyroid FDG uptake in the published case.

Original context: Nivolumab in lung cancer.

Park Hyesun, Hata Akinori, Hatabu Hiroto et al.. Cancers (Basel). 2023 Jan 20;15(3):649. doi: 10.3390/cancers15030649. Figure 3.
Immune-Related Thyroiditis in Patients with Advanced Lung Cancer Treated with Immune Checkpoint Inhibitors: Imaging Features and Clinical Implications

Original figure & article ↗ · CC BY 4.0 ↗

None. Original figure, unmodified; all published panels and annotations retained.

Used in: Checkpoint-associated thyroiditis

File provenance

Source: PubMed Central / U.S. National Library of Medicine. Retrieved 2026-10-28 Retrieved from the official PMC Open Access dataset. This stored copy may not include later source updates. No NLM endorsement.

SHA-256: c405c320e170bf064680c3a1d3e03987f30f1cb7f1655fde646e76e3751f0879

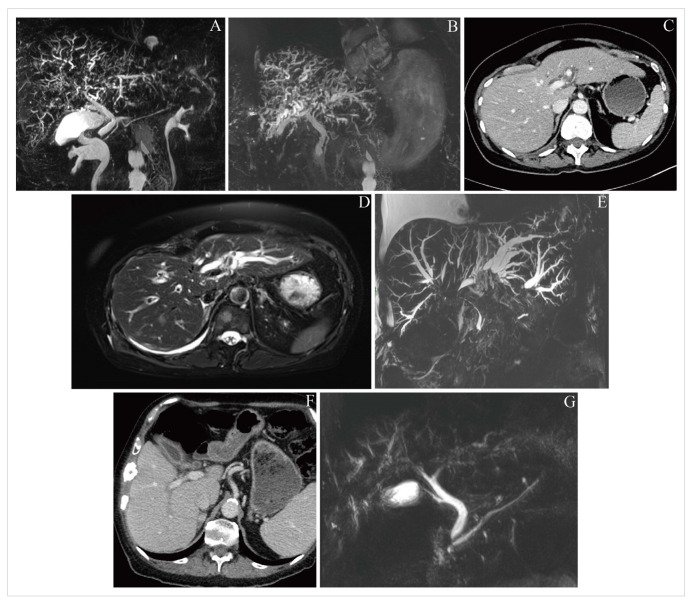
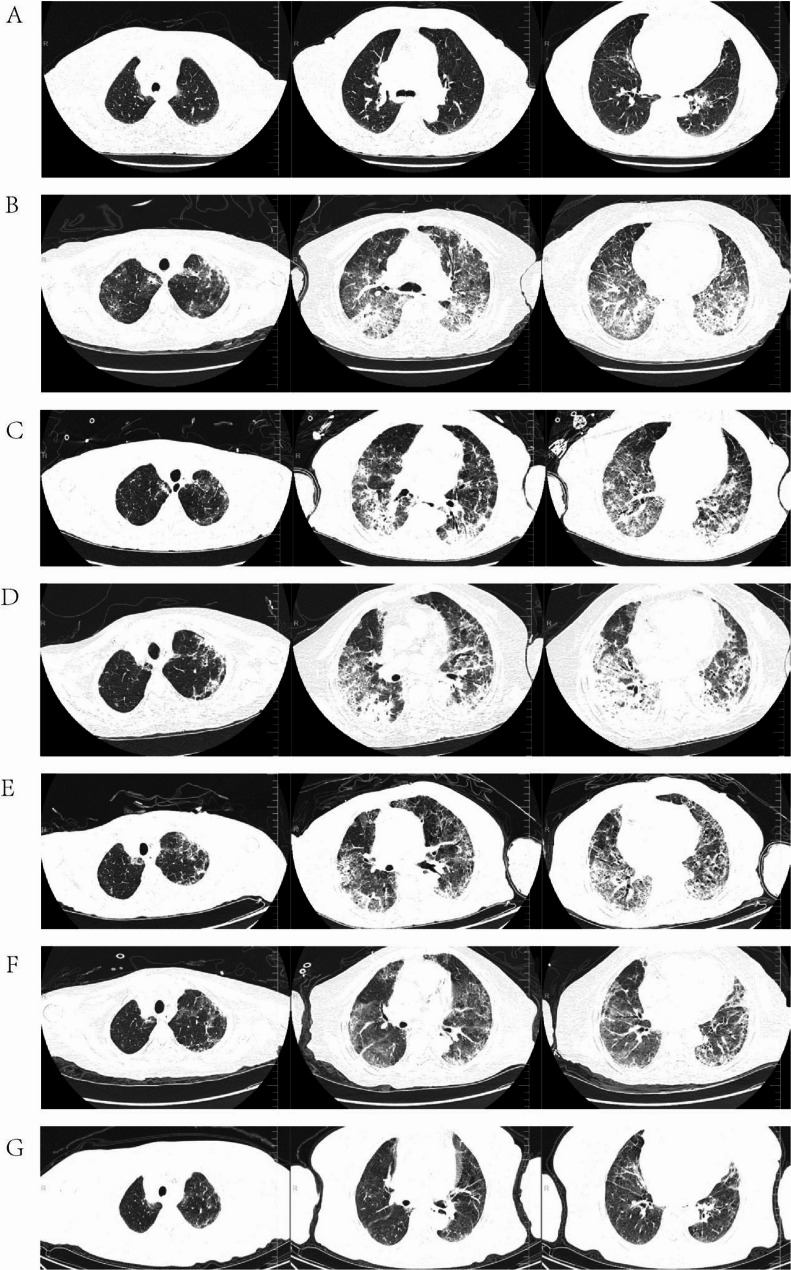
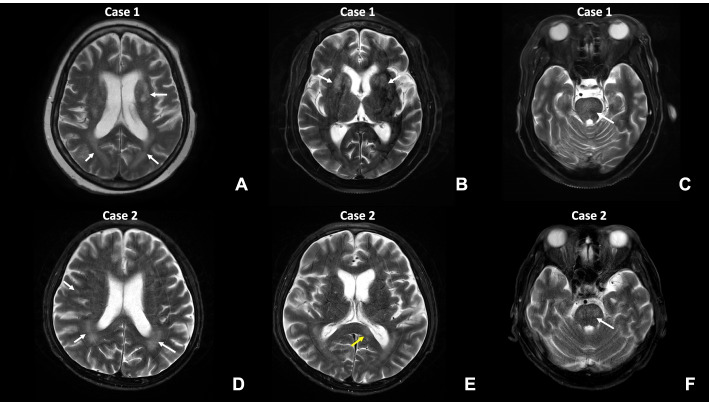
CT/MRCP cholangiopathy in three separately identified patients.
treatment example · Figure 2

CT/MRCP cholangiopathy in three separately identified patients.

Original context: Case 1 pembrolizumab; case 2 pembrolizumab/carboplatin/pemetrexed; case 3 nivolumab.

Panels A/B repeat case 1, C/D/E repeat case 2, F/G repeat case 3. Seven panels represent three patients.

Gray Simon, Santamaria Nuria, Olsson-Brown Anna. Explor Target Antitumor Ther. 2024 Jul 19;5(4):818–25. doi: 10.37349/etat.2024.00250. Figure 2.
Immune checkpoint inhibitor-induced cholangitis—a three-case series

Original figure & article ↗ · CC BY 4.0 ↗

None. Original figure, unmodified; all published panels and annotations retained.

Used in: ICI-associated cholangitis

File provenance

Source: PubMed Central / U.S. National Library of Medicine. Retrieved 2026-10-28 Retrieved from the official PMC Open Access dataset. This stored copy may not include later source updates. No NLM endorsement.

SHA-256: 67c77bec9a7dcd566616f46d286344da962008a02a19a2dbe8f072b92c72b482

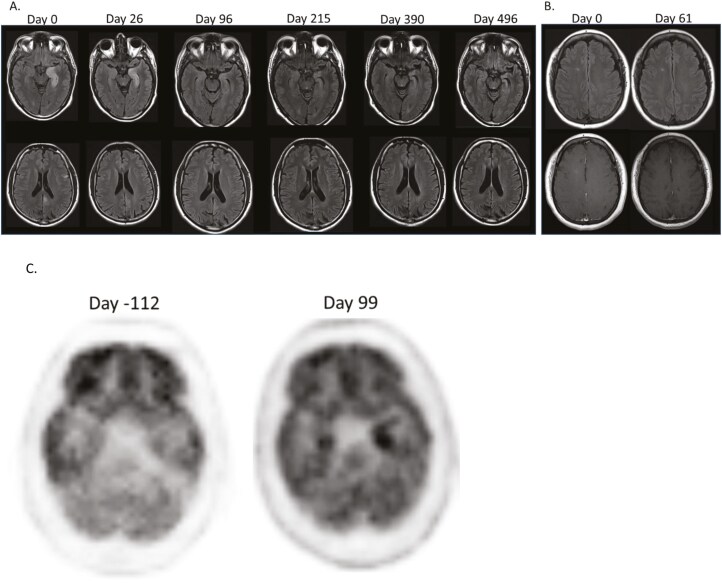
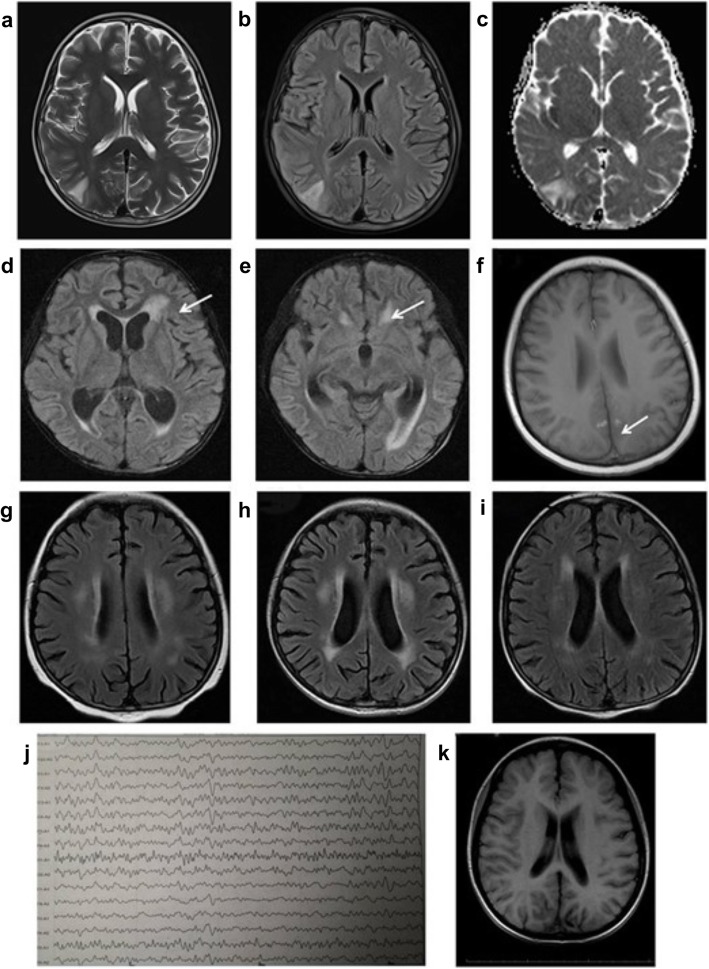
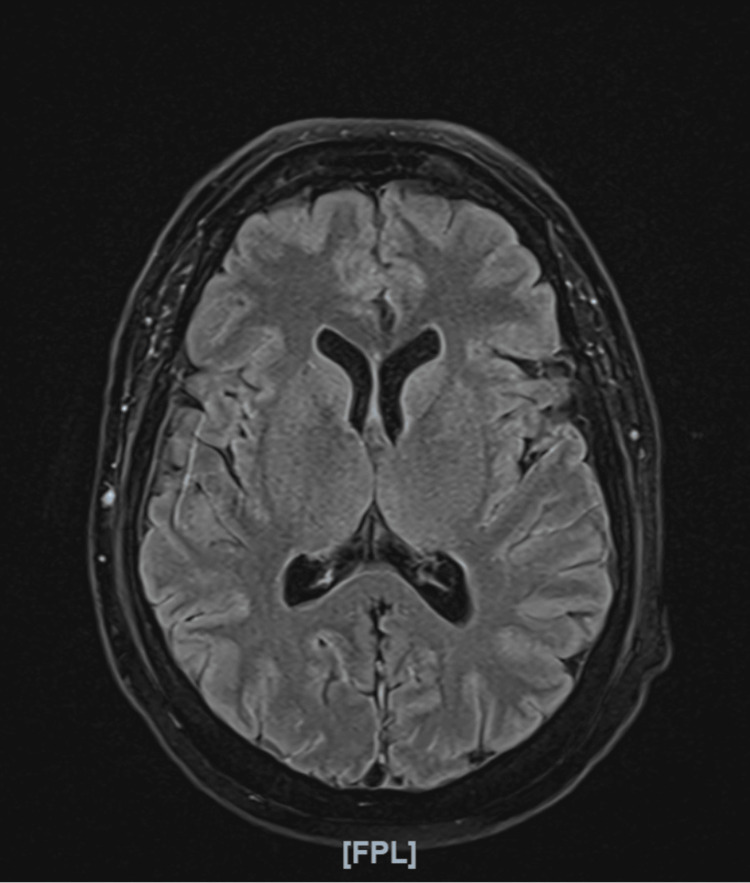
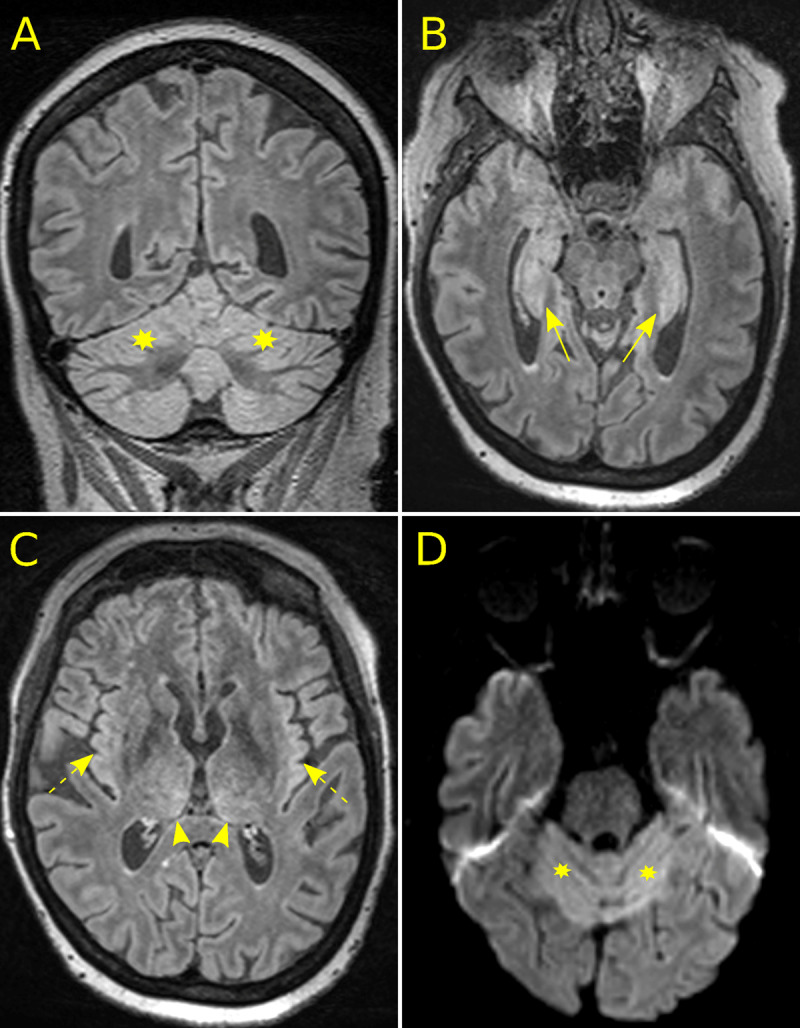
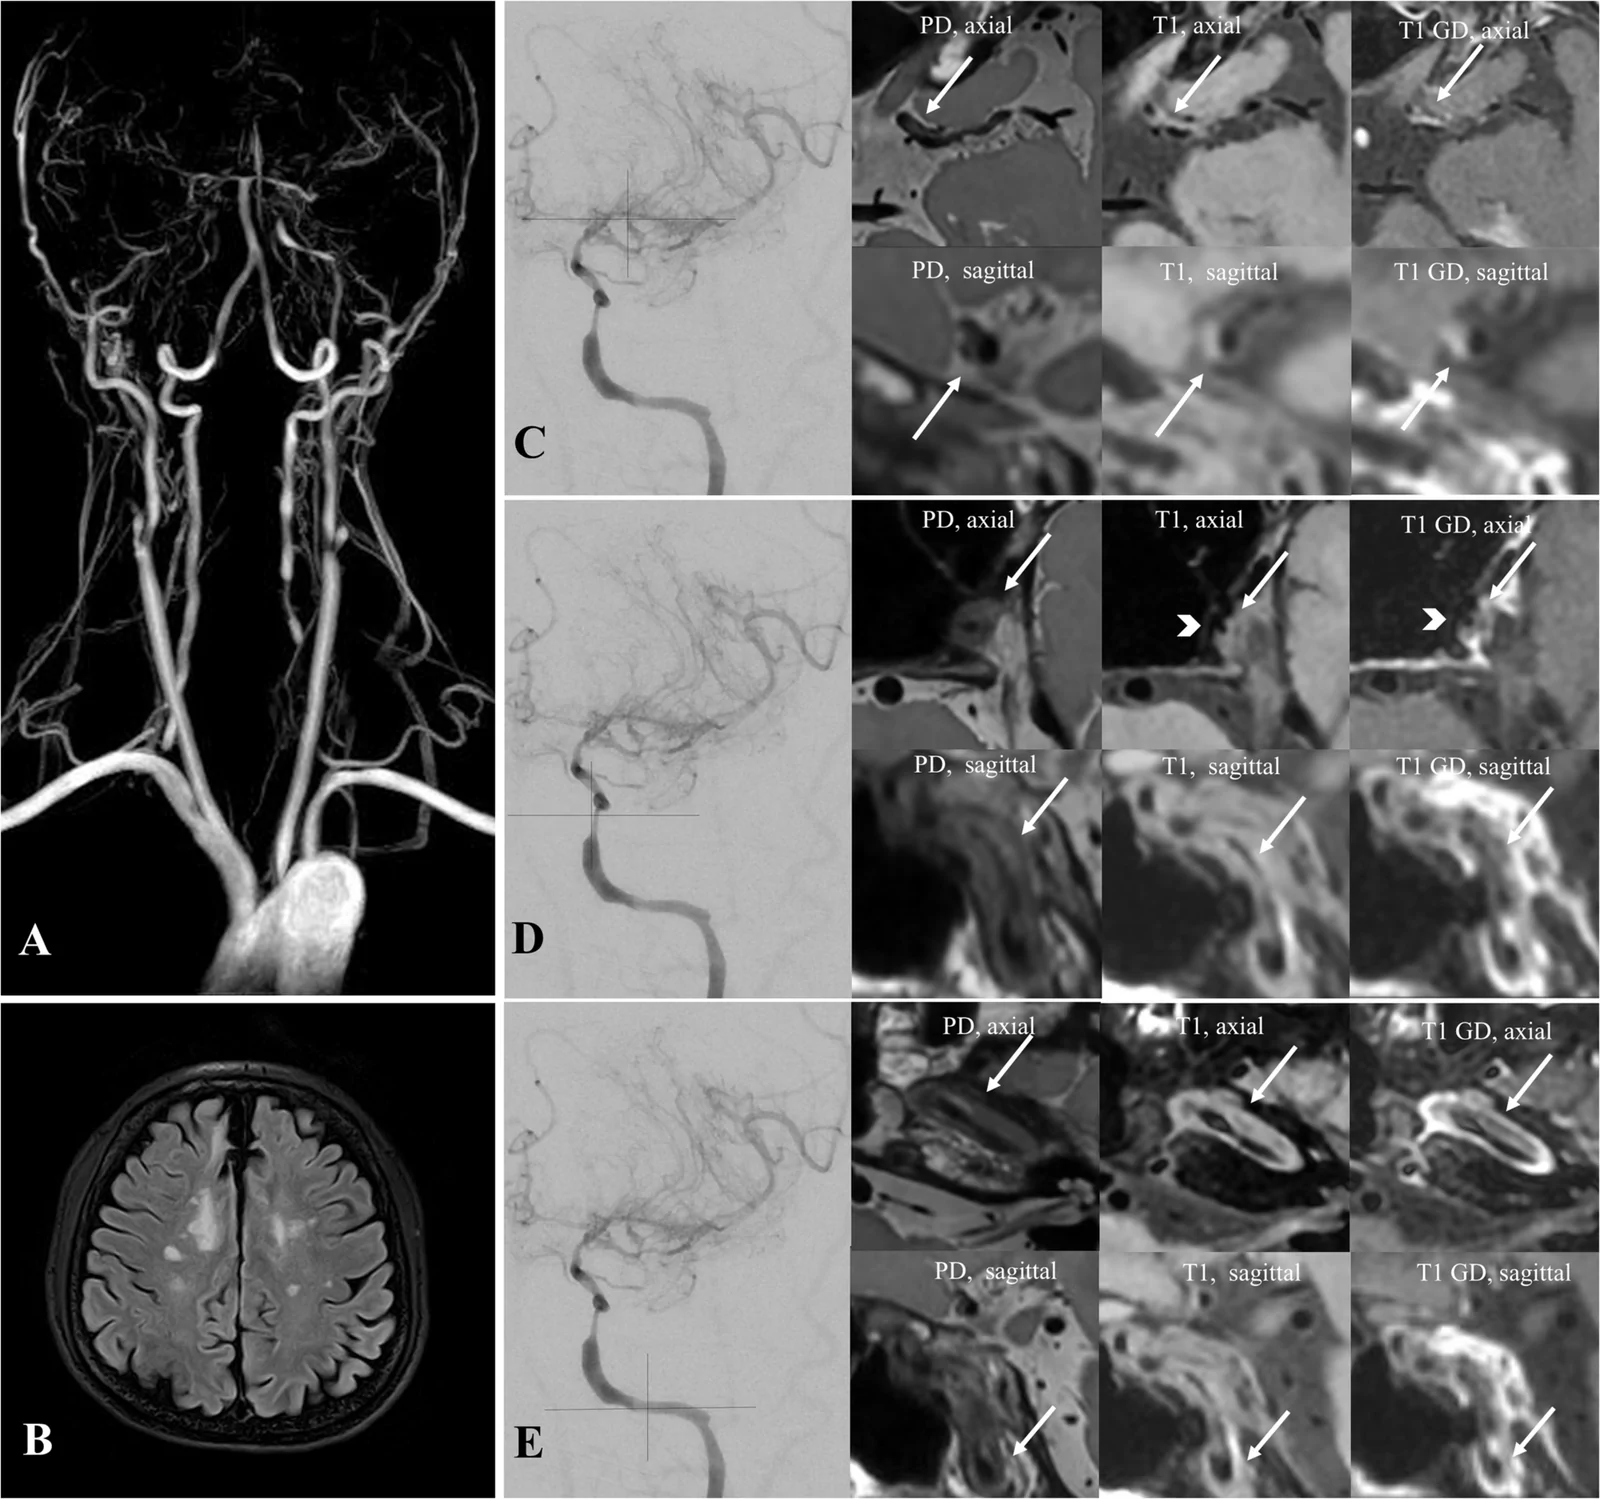
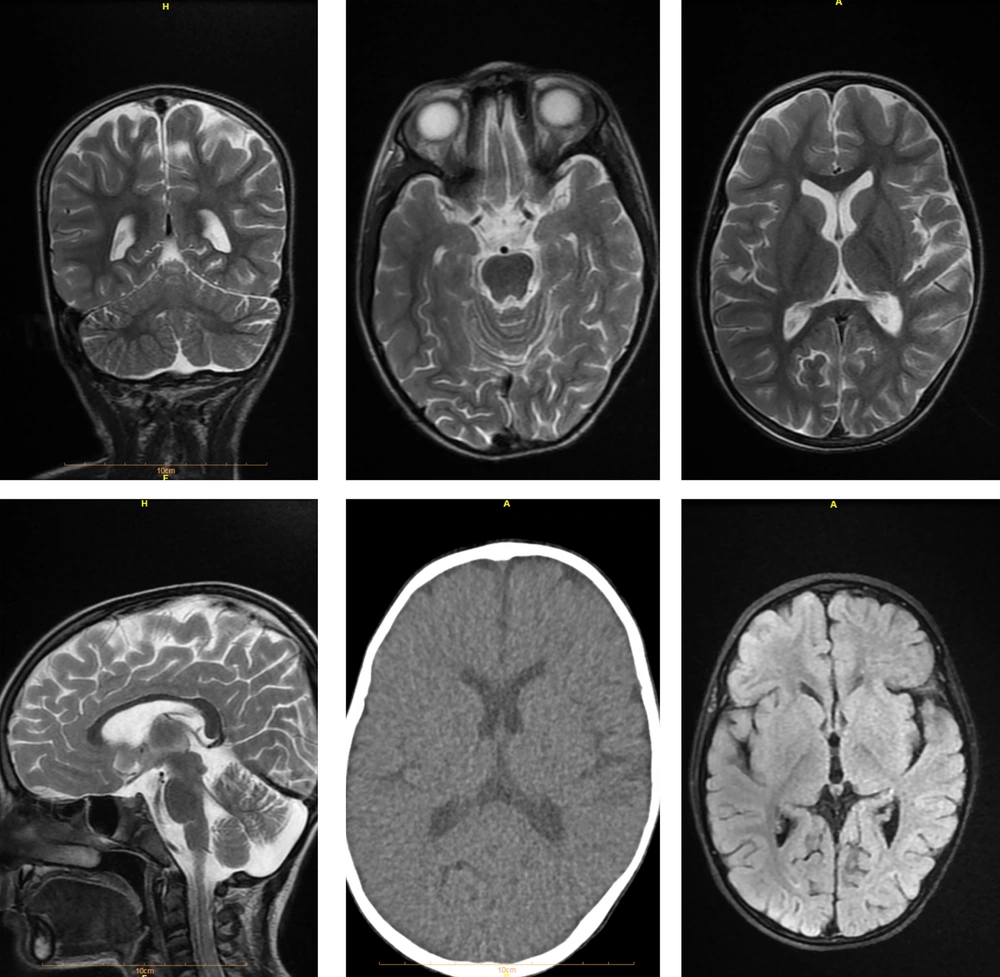
MRI and brain FDG-PET examples from the selected encephalitis series.
treatment example · Figure 1.

MRI and brain FDG-PET examples from the selected encephalitis series.

Original context: Immune checkpoint inhibitor exposure; separate patients and sequences in the original panels.

Buckley Monica W, Balaji Warner Aanika, Brahmer Julie et al.. Oncologist. 2024 Jul 26;30(1):oyae186. doi: 10.1093/oncolo/oyae186. Figure 1..
Immune-related encephalitis after immune checkpoint inhibitor therapy

Original figure & article ↗ · CC BY 4.0 ↗

None. Original figure, unmodified; all published panels and annotations retained.

Used in: Checkpoint-associated encephalitis

File provenance

Source: PubMed Central / U.S. National Library of Medicine. Retrieved 2026-10-28 Retrieved from the official PMC Open Access dataset. This stored copy may not include later source updates. No NLM endorsement.

SHA-256: 7587b468ab7836d39325690b8a70b1efb4d74872163c8af279ac7ef6ad425a5e

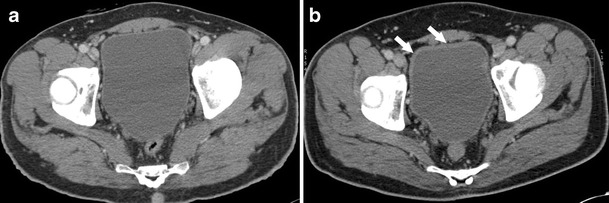
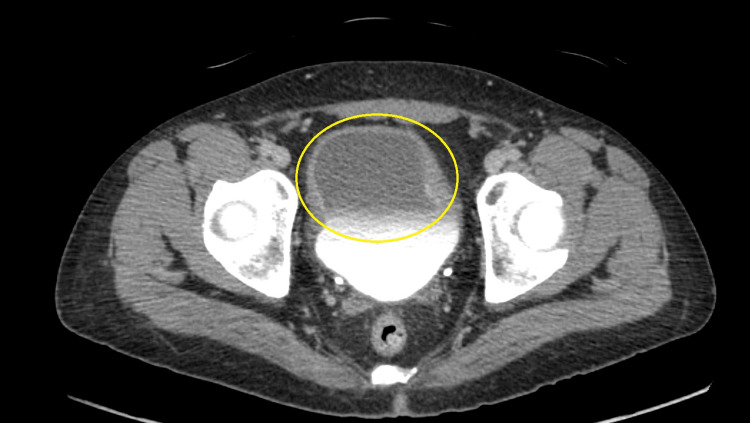
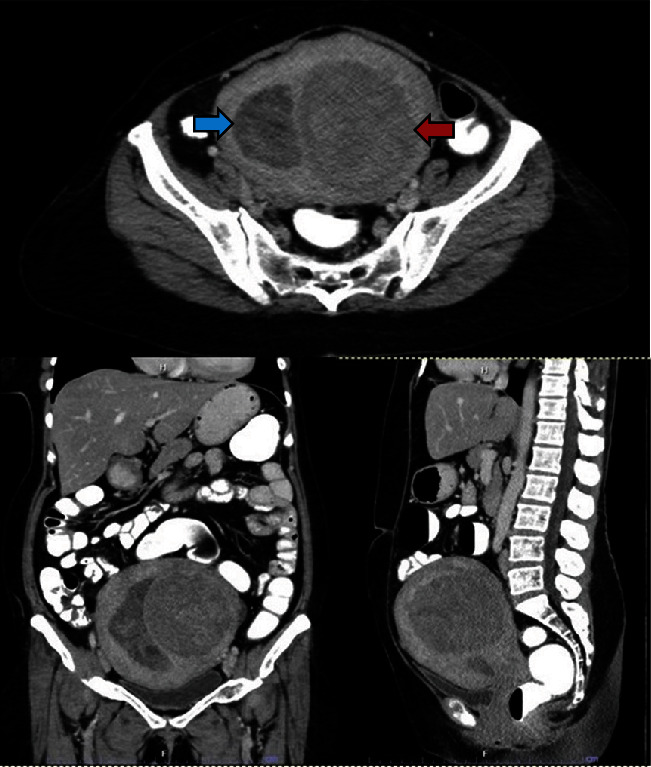
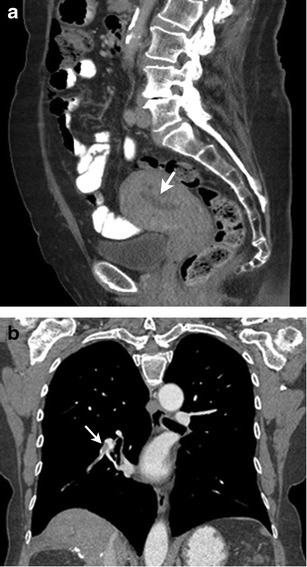
CT bladder-wall thickening in hemorrhagic cystitis.
treatment example · Fig. 7

CT bladder-wall thickening in hemorrhagic cystitis.

Original context: Cyclophosphamide in a 44-year-old man with lymphoma.

Jia Jemianne Bautista, Lall Chandana, Tirkes Temel et al.. Insights Imaging. 2015 Jul 11;6(4):479–87. doi: 10.1007/s13244-015-0417-x. Fig. 7.
Chemotherapy-related complications in the kidneys and collecting system: an imaging perspective

Original figure & article ↗ · CC BY 4.0 ↗

None. Original figure, unmodified; all published panels and annotations retained.

Used in: Cyclophosphamide-associated hemorrhagic cystitis · Ifosfamide-associated hemorrhagic cystitis · Haemorrhagic cystitis after HCT

File provenance

Source: PubMed Central / U.S. National Library of Medicine. Retrieved 2026-10-28 Retrieved from the official PMC Open Access dataset. This stored copy may not include later source updates. No NLM endorsement.

SHA-256: 16941fb8f0040355d951e19f11c5b2f8e4094eb8dc0864a3a6a1921aacbc7405

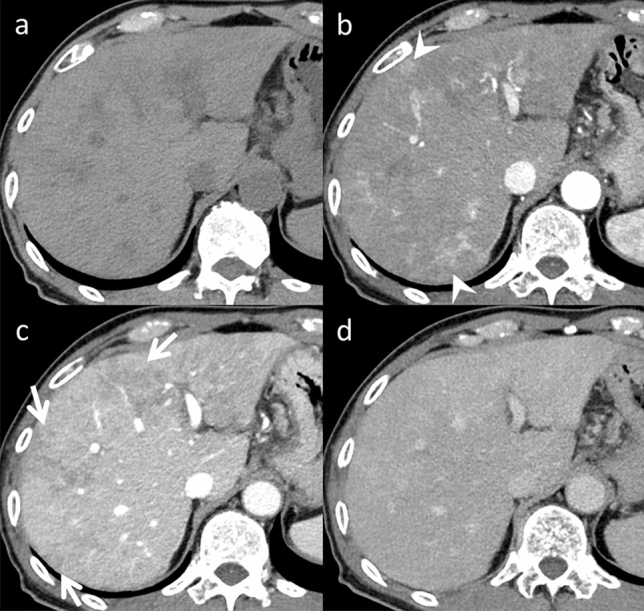
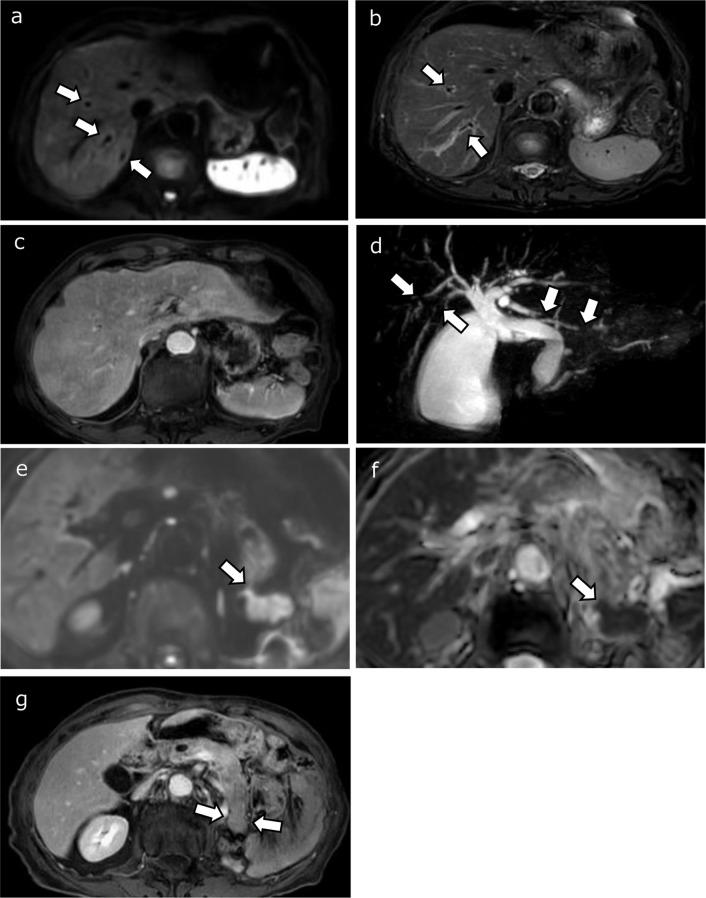
CT reticular hepatic hypoattenuation in SOS.
treatment example · Fig. 2

CT reticular hepatic hypoattenuation in SOS.

Original context: S-1 plus oxaliplatin in a 65-year-old man.

Same patient as Figure 3; this annotation prevents counting CT and MRI as independent cases.

Ichikawa Shintaro, Goshima Satoshi. Jpn J Radiol. 2023 Nov 6;42(3):235–45. doi: 10.1007/s11604-023-01505-z. Fig. 2.
Key CT and MRI findings of drug-associated hepatobiliary and pancreatic disorders

Original figure & article ↗ · CC BY 4.0 ↗

None. Original figure, unmodified; all published panels and annotations retained.

Used in: Oxaliplatin-associated sinusoidal liver injury

File provenance

Source: PubMed Central / U.S. National Library of Medicine. Retrieved 2026-10-28 Retrieved from the official PMC Open Access dataset. This stored copy may not include later source updates. No NLM endorsement.

SHA-256: c59f9eb4c12f63eeaa97c3fac2c78019a7433c086591e48945dafa65d6218992

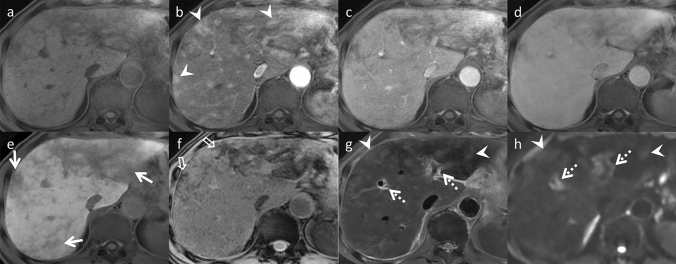
Reticular liver abnormality on gadoxetic MRI.
treatment example · Fig. 3

Reticular liver abnormality on gadoxetic MRI.

Original context: S-1 plus oxaliplatin in a 65-year-old man.

Source exposure remains explicit. In PMC10899361, Figures 2 and 3 are the same patient.

Ichikawa Shintaro, Goshima Satoshi. Jpn J Radiol. 2023 Nov 6;42(3):235–45. doi: 10.1007/s11604-023-01505-z. Fig. 3.
Key CT and MRI findings of drug-associated hepatobiliary and pancreatic disorders

Original figure & article ↗ · CC BY 4.0 ↗

None. Original figure, unmodified; all published panels and annotations retained.

Used in: Oxaliplatin-associated sinusoidal liver injury · Hepatic sinusoidal obstruction after transplantation · Hepatic SOS / VOD after inotuzumab · SOS / VOD after gemtuzumab ozogamicin

File provenance

Source: PubMed Central / U.S. National Library of Medicine. Retrieved 2026-10-28 Retrieved from the official PMC Open Access dataset. This stored copy may not include later source updates. No NLM endorsement.

SHA-256: 44192f184d88337267e0ed4769b7e2aa9ea2cf265ccd1f50efec925bc2898fac

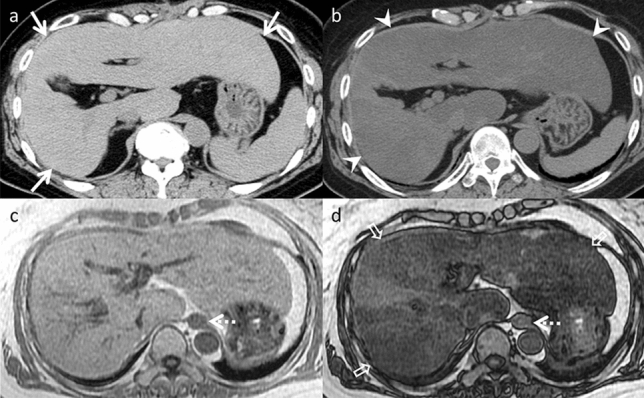
CT and chemical-shift MRI show treatment-associated liver fat.
treatment example · Fig. 9

CT and chemical-shift MRI show treatment-associated liver fat.

Original context: Irinotecan-containing chemotherapy in a 62-year-old woman.

A single patient across CT/MRI and follow-up. Imaging cannot separate simple fat from steatohepatitis.

Ichikawa Shintaro, Goshima Satoshi. Jpn J Radiol. 2023 Nov 6;42(3):235–45. doi: 10.1007/s11604-023-01505-z. Fig. 9.
Key CT and MRI findings of drug-associated hepatobiliary and pancreatic disorders

Original figure & article ↗ · CC BY 4.0 ↗

None. Original figure, unmodified; all published panels and annotations retained.

Used in: Irinotecan-associated fatty liver / steatohepatitis

File provenance

Source: PubMed Central / U.S. National Library of Medicine. Retrieved 2026-10-28 Retrieved from the official PMC Open Access dataset. This stored copy may not include later source updates. No NLM endorsement.

SHA-256: 78c1db7b9d9fc225a60f991706e6b65e7cecd8c62367618a7f445659eb258e51

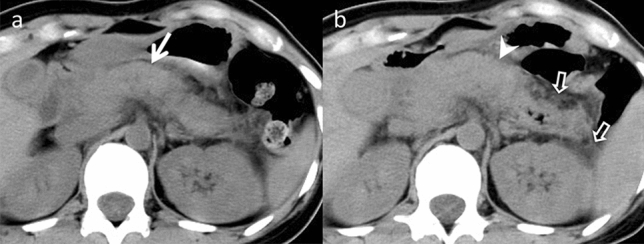
CT pancreatic enlargement and inflammatory fat stranding.
pattern example · Fig. 12

CT pancreatic enlargement and inflammatory fat stranding.

Original context: L-asparaginase in a 30-year-old woman with ALL; pegylated formulation not named.

Asparaginase-context example; source does not identify pegaspargase.

Ichikawa Shintaro, Goshima Satoshi. Jpn J Radiol. 2023 Nov 6;42(3):235–45. doi: 10.1007/s11604-023-01505-z. Fig. 12.
Key CT and MRI findings of drug-associated hepatobiliary and pancreatic disorders

Original figure & article ↗ · CC BY 4.0 ↗

None. Original figure, unmodified; all published panels and annotations retained.

Used in: Pegaspargase-associated pancreatitis

File provenance

Source: PubMed Central / U.S. National Library of Medicine. Retrieved 2026-10-28 Retrieved from the official PMC Open Access dataset. This stored copy may not include later source updates. No NLM endorsement.

SHA-256: aee7c9ad0a6eb80d5fa2c426d3cb323a4a4818e09ba025851b4270ff759822a9

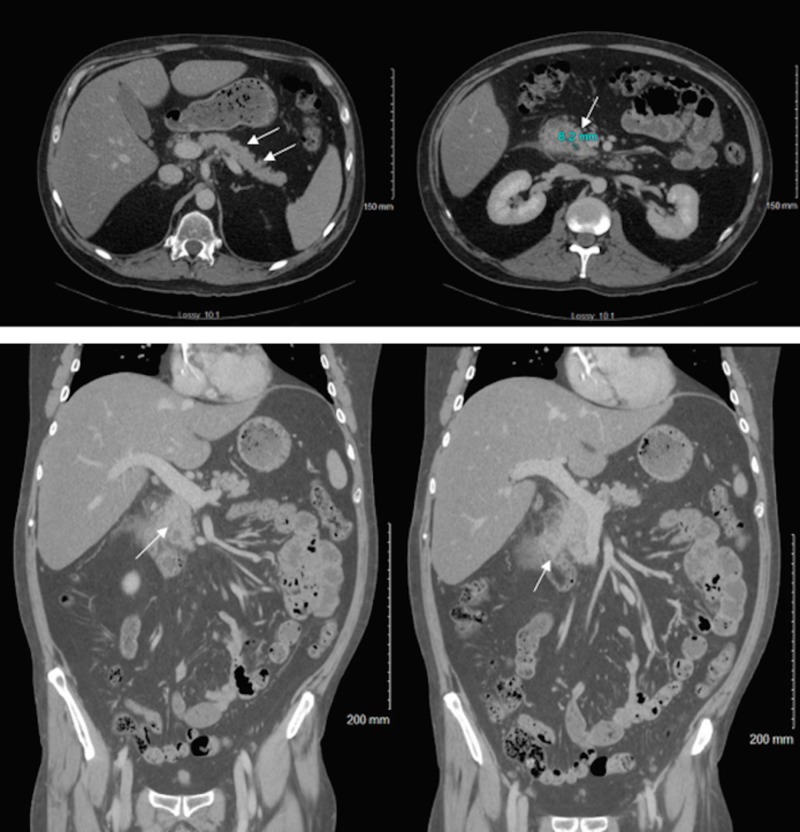
Pancreatic and biliary changes across CT, MRI and MRCP.
treatment example · Fig. 15

Pancreatic and biliary changes across CT, MRI and MRCP.

Original context: Nivolumab in a 65-year-old man with renal-cell carcinoma.

One patient followed over time; steroid-response panels are not additional cases.

Ichikawa Shintaro, Goshima Satoshi. Jpn J Radiol. 2023 Nov 6;42(3):235–45. doi: 10.1007/s11604-023-01505-z. Fig. 15.
Key CT and MRI findings of drug-associated hepatobiliary and pancreatic disorders

Original figure & article ↗ · CC BY 4.0 ↗

None. Original figure, unmodified; all published panels and annotations retained.

Used in: ICI-associated pancreatic inflammation · ICI-associated cholangitis

File provenance

Source: PubMed Central / U.S. National Library of Medicine. Retrieved 2026-10-28 Retrieved from the official PMC Open Access dataset. This stored copy may not include later source updates. No NLM endorsement.

SHA-256: a68c59e6f0b605276f51c9e99c3c8f5e36ec7b5aa10dbeb99fb294b1d06e3300

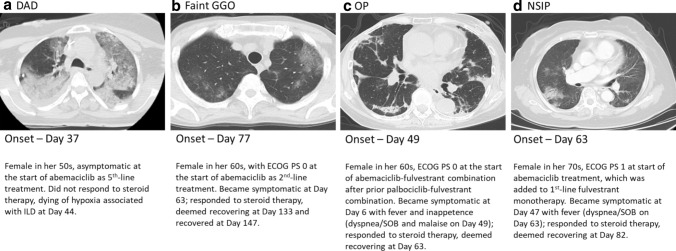
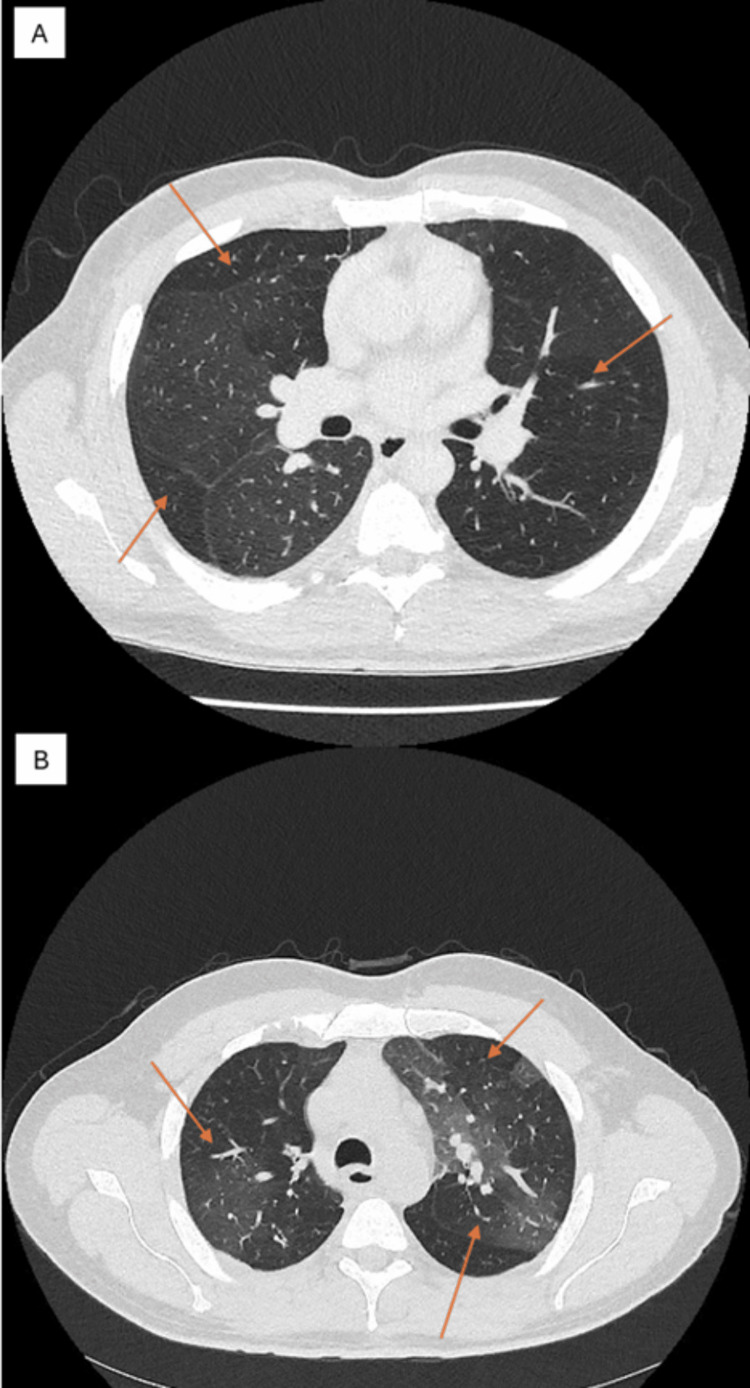
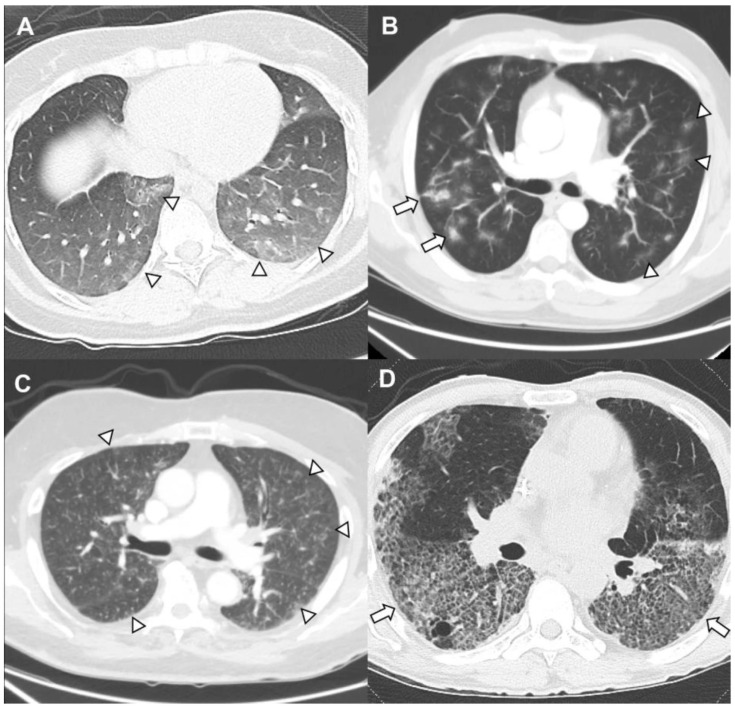
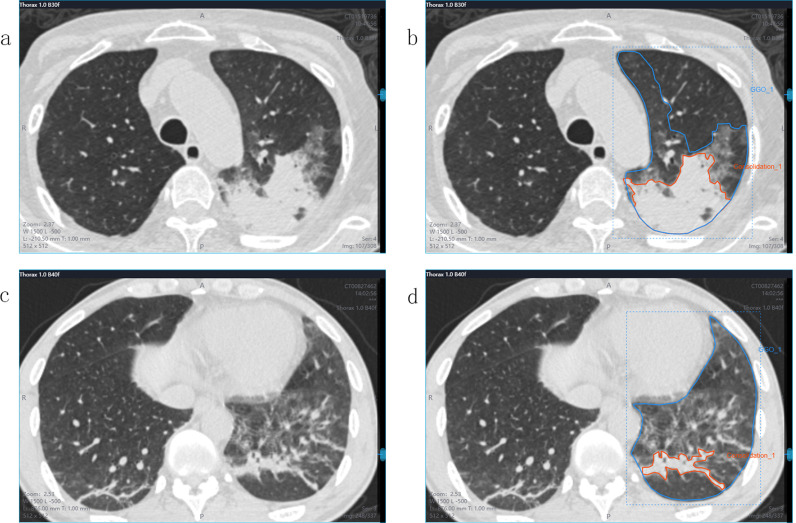
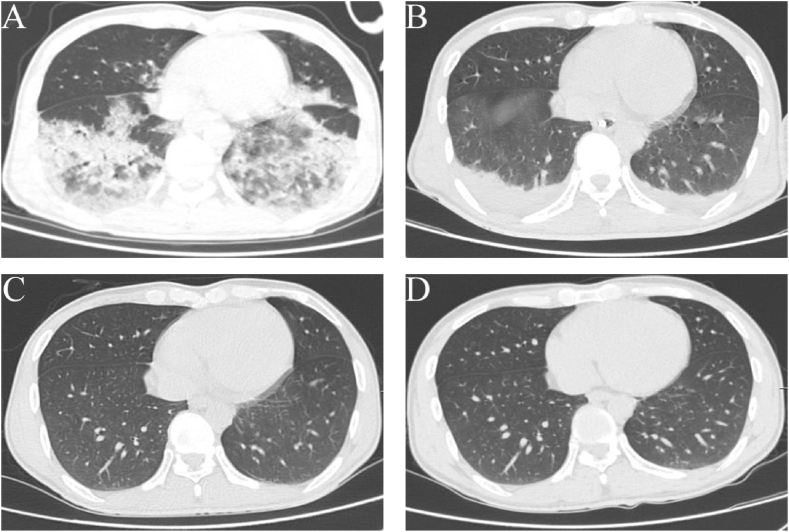
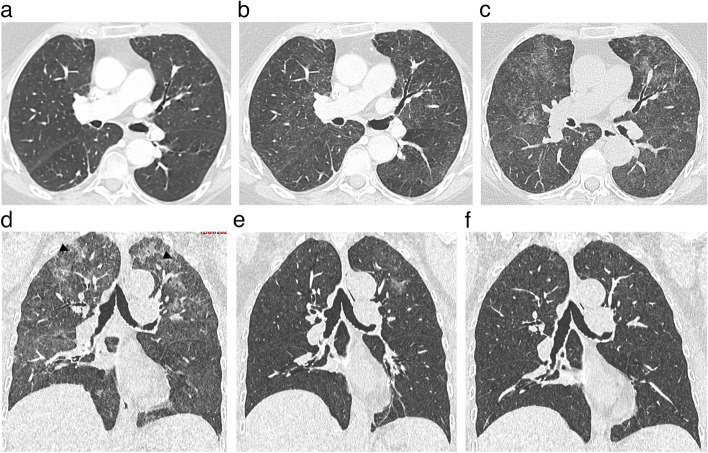
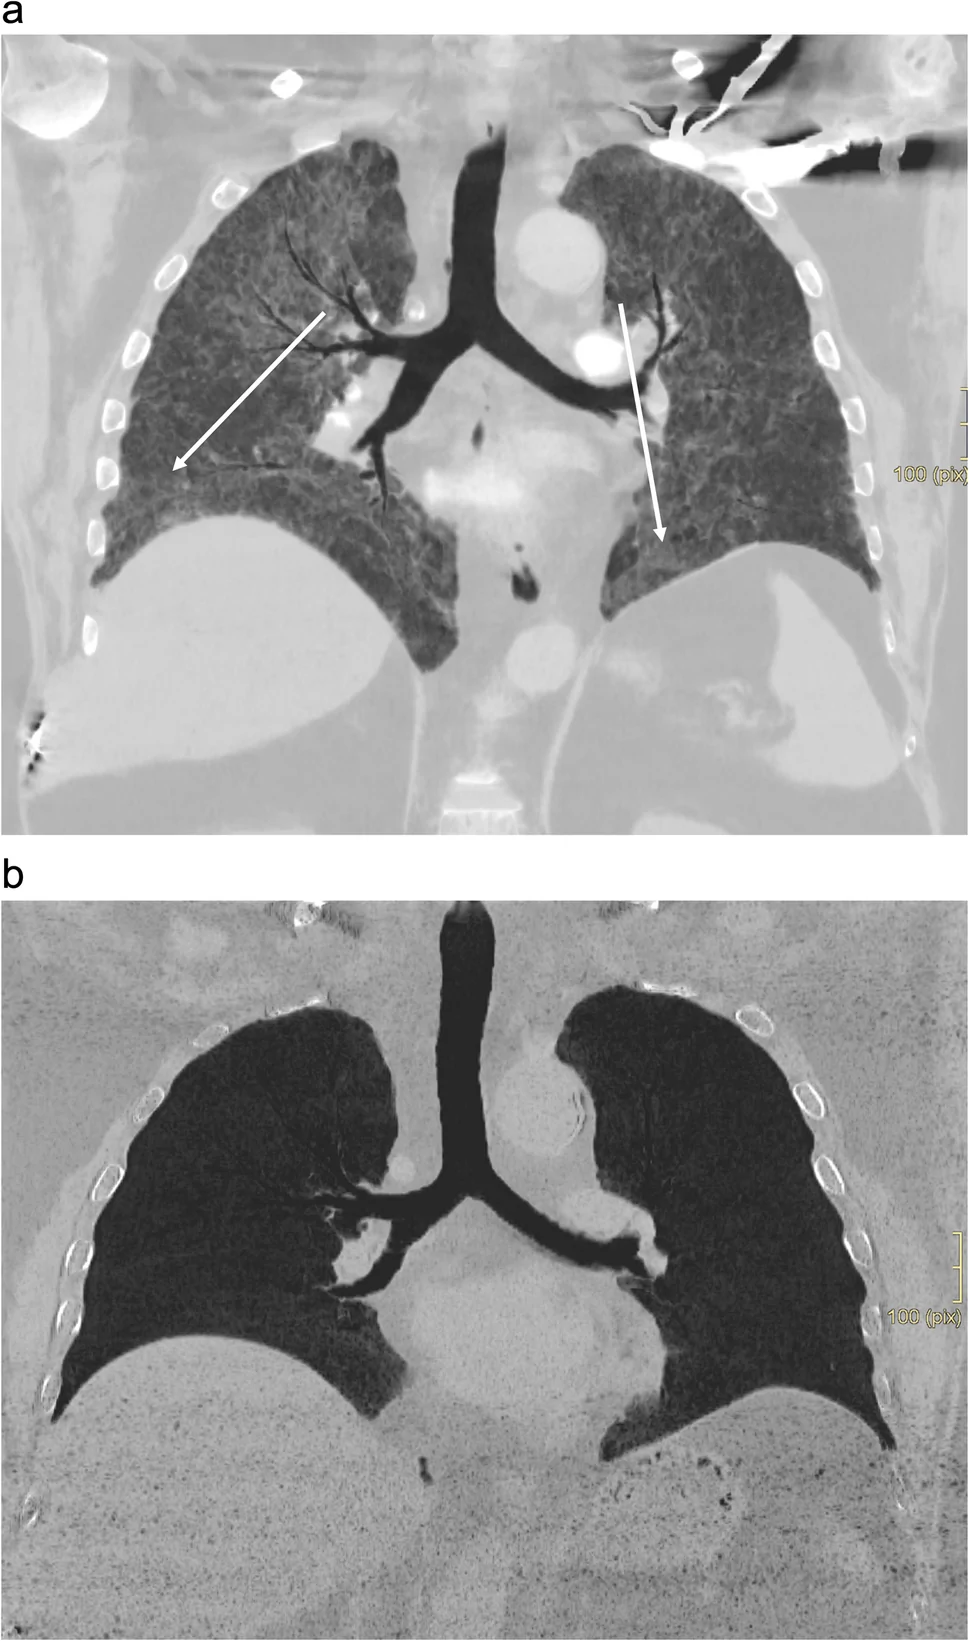
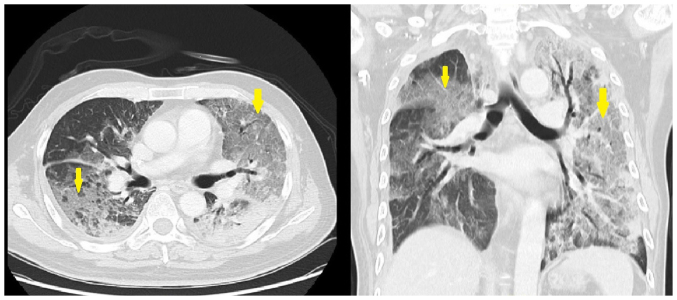
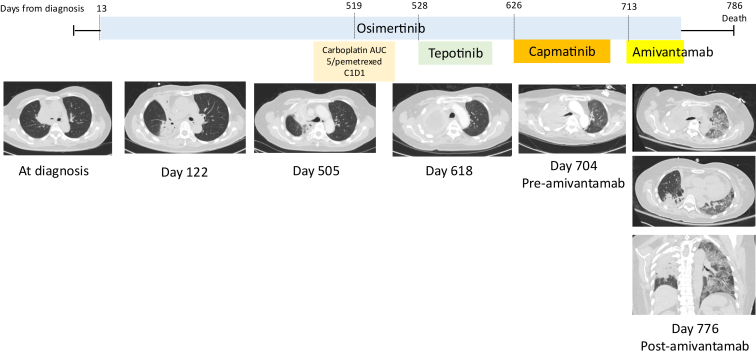
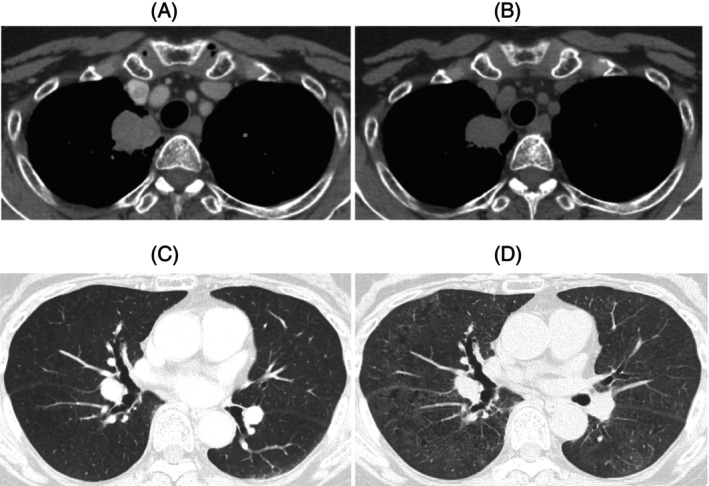
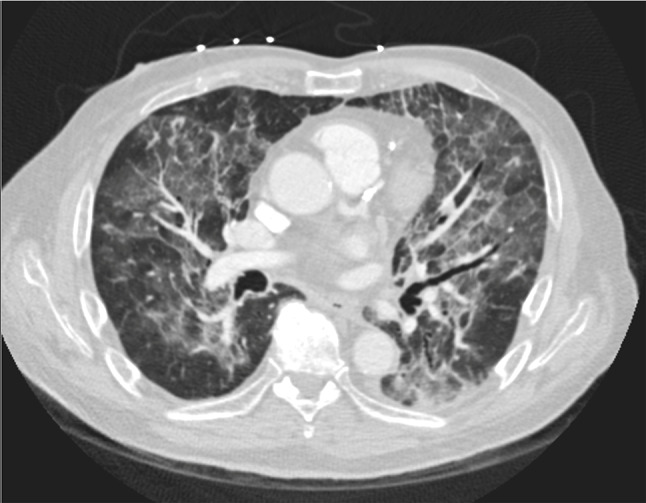
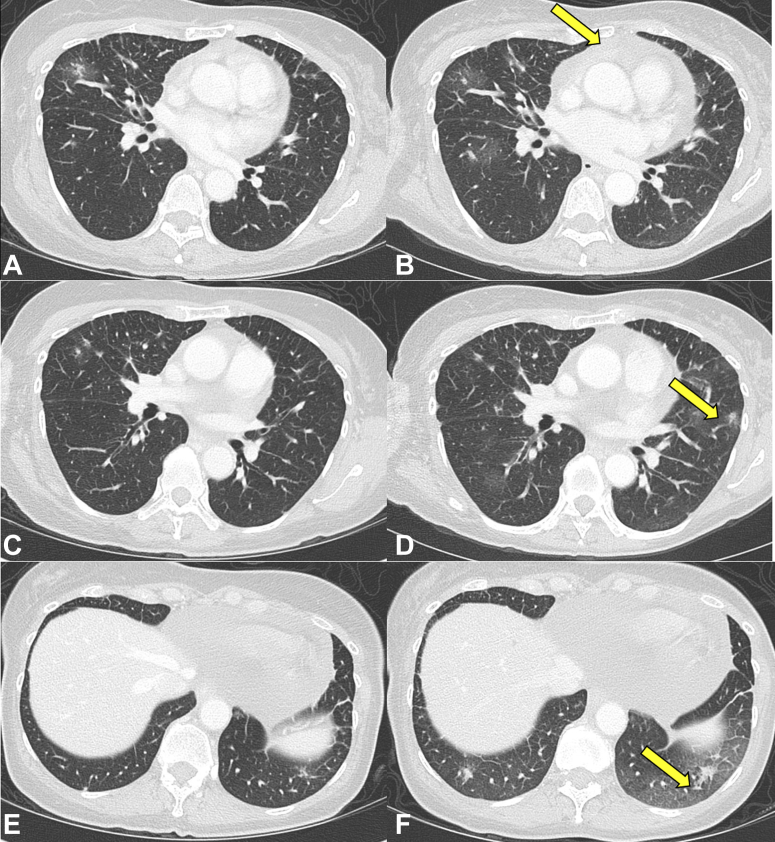
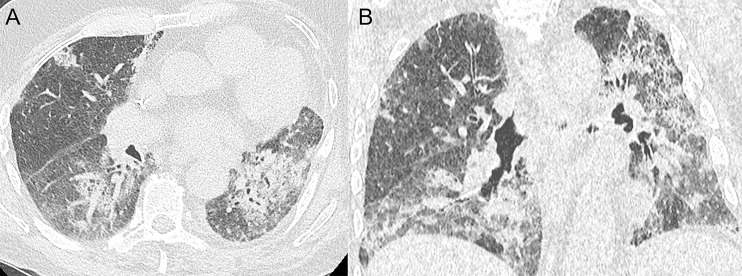
Four distinct abemaciclib-exposed patients: DAD, faint ground-glass opacity, OP and NSIP patterns. One original composite figure, four source patients.
pattern example · Fig. 4

Four distinct abemaciclib-exposed patients: DAD, faint ground-glass opacity, OP and NSIP patterns. One original composite figure, four source patients.

Original context: Abemaciclib in Japanese metastatic breast-cancer post-marketing cohort; concomitant endocrine therapy varies.

Pattern example outside the abemaciclib card; other drug causality is not transferred. Panels A–D represent four explicitly distinct source patients.

Chen Yucherng, Noma Satoshi, Taguchi Yoshio et al.. Breast Cancer. 2021 Jan 16;28(3):710–9. doi: 10.1007/s12282-020-01207-8. Fig. 4.
Characteristics of interstitial lung disease in patients from post-marketing data on metastatic breast cancer patients who received abemaciclib in Japan

Original figure & article ↗ · CC BY 4.0 ↗

None. Original figure, unmodified; all published panels and annotations retained.

Used in: Abemaciclib-associated ILD / pneumonitis · Osimertinib-associated ILD / pneumonitis · Alectinib-associated ILD / pneumonitis · Crizotinib-associated lung injury · Enfortumab vedotin-associated pneumonitis · Erlotinib-associated ILD / pneumonitis · Everolimus-related pneumonitis · Gefitinib-associated ILD / pneumonitis · ILD / pneumonitis reported with apalutamide · Olaparib-associated ILD / pneumonitis · Paclitaxel-associated pneumonitis · Palbociclib-associated ILD / pneumonitis · Pemetrexed-associated interstitial pneumonitis · Ribociclib-associated ILD / pneumonitis · Temsirolimus-related pneumonitis · Early pulmonary events on brigatinib · Sirolimus-associated pneumonitis · T-DXd–associated ILD / pneumonitis · Pomalidomide-associated lung injury / pneumonitis · Capmatinib-associated lung injury / pneumonitis · Cetuximab-associated lung injury / pneumonitis · Amivantamab-associated lung injury / pneumonitis · Sotorasib-associated lung injury / pneumonitis · Lenalidomide-associated lung injury / pneumonitis · Telisotuzumab vedotin-associated ILD / pneumonitis · Datopotamab deruxtecan-associated ILD / pneumonitis

File provenance

Source: PubMed Central / U.S. National Library of Medicine. Retrieved 2026-10-28 Retrieved from the official PMC Open Access dataset. This stored copy may not include later source updates. No NLM endorsement.

SHA-256: 9c695e33d3c17c07897d1cb74a1924aaedaed90722e87049c3f897dc653241b0

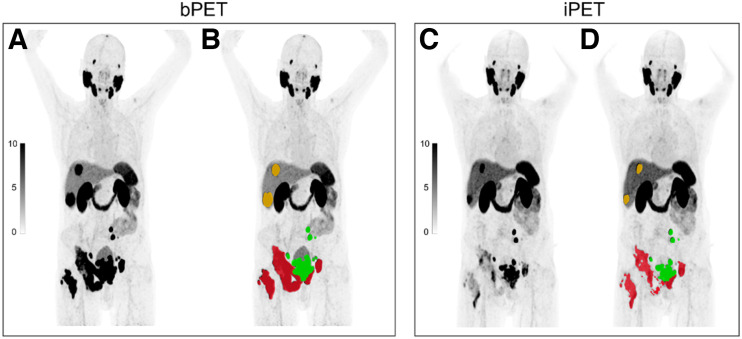
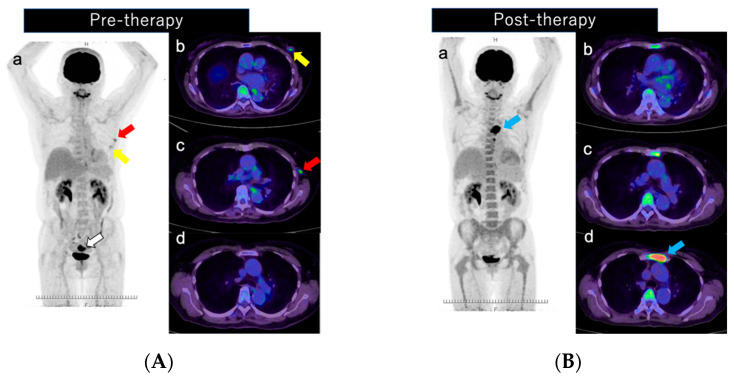
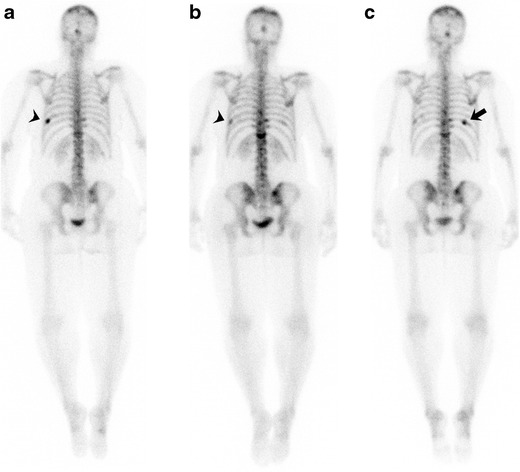
Paired PSMA PET scans with tumor-volume segmentation.
treatment example · FIGURE 2.

Paired PSMA PET scans with tumor-volume segmentation.

Original context: Lu-PSMA therapy in the RECIP development cohort.

Before/after and segmented/unsegmented views are one example, not four patients. Figure does not individually identify PSMA-617 versus I&T.

Gafita Andrei, Rauscher Isabel, Weber Manuel et al.. J Nucl Med. 2022 Nov;63(11):1651–8. doi: 10.2967/jnumed.121.263072. FIGURE 2..
Novel Framework for Treatment Response Evaluation Using PSMA PET/CT in Patients with Metastatic Castration-Resistant Prostate Cancer (RECIP 1.0): An International Multicenter Study

Original figure & article ↗ · CC BY 4.0 ↗

None. Original figure, unmodified; all published panels and annotations retained.

Used in: Mixed PSMA-PET response during Lu-PSMA therapy

File provenance

Source: PubMed Central / U.S. National Library of Medicine. Retrieved 2026-10-28 Retrieved from the official PMC Open Access dataset. This stored copy may not include later source updates. No NLM endorsement.

SHA-256: bfecca3f58770fe0413c90b7d7dd00870fd27680593c4a243420b976395826c2

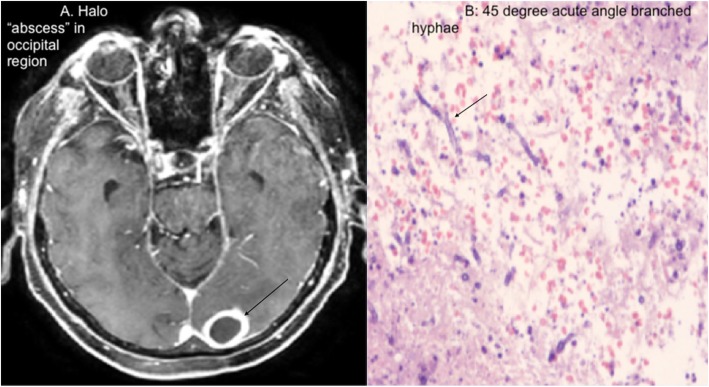
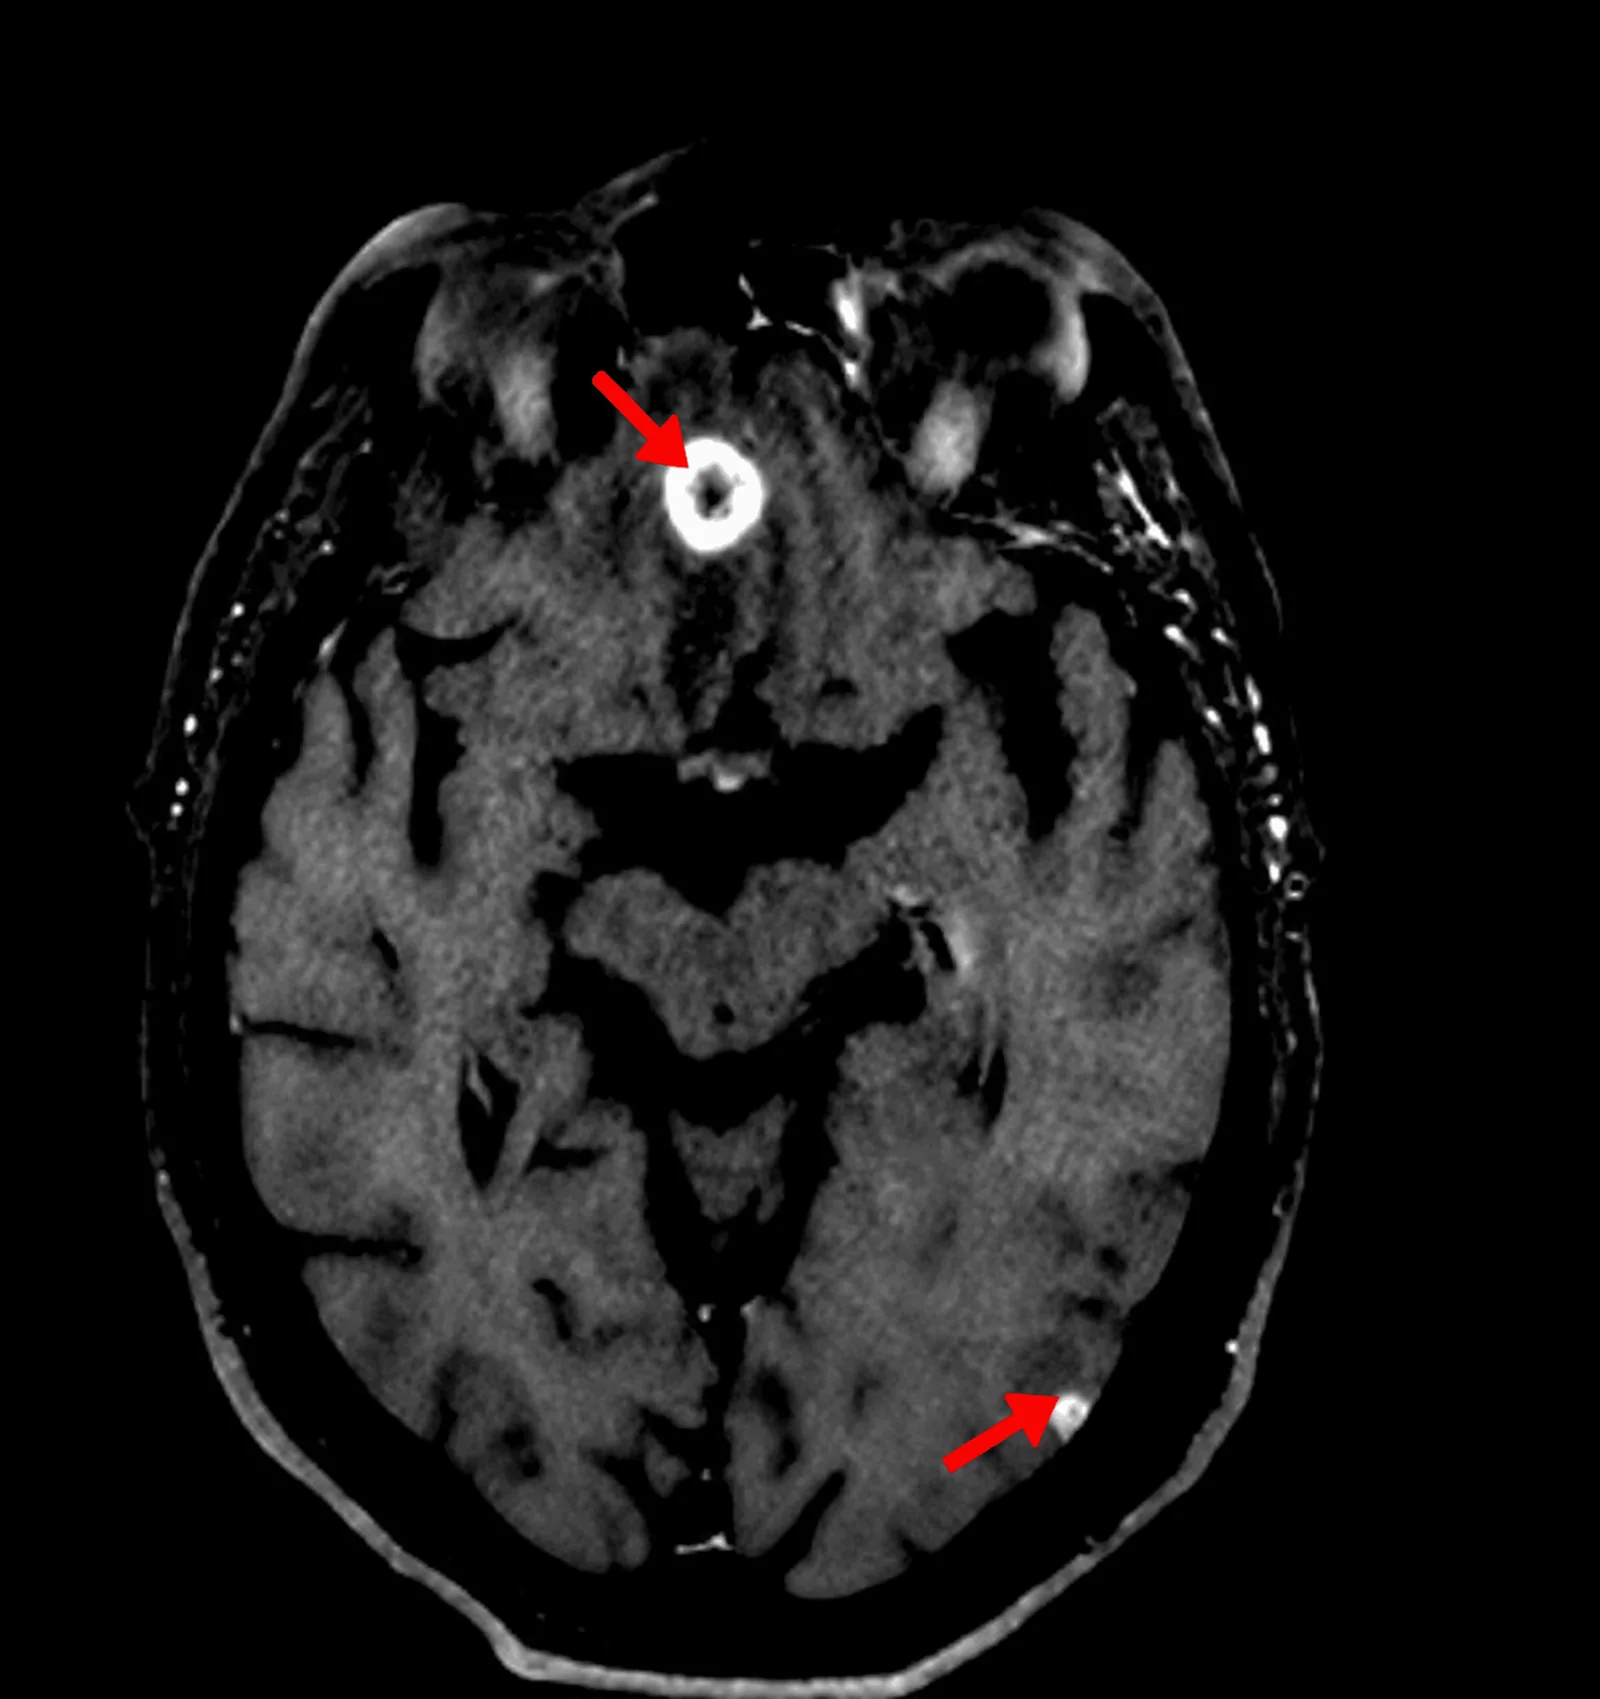
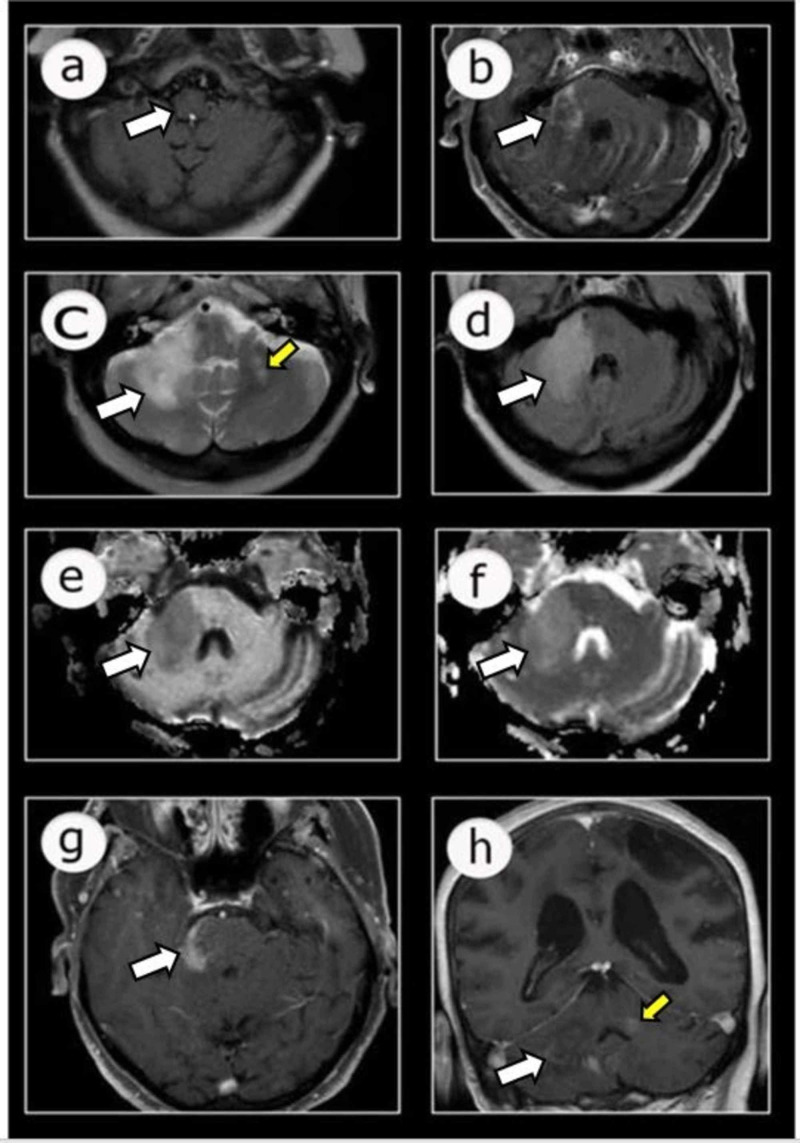
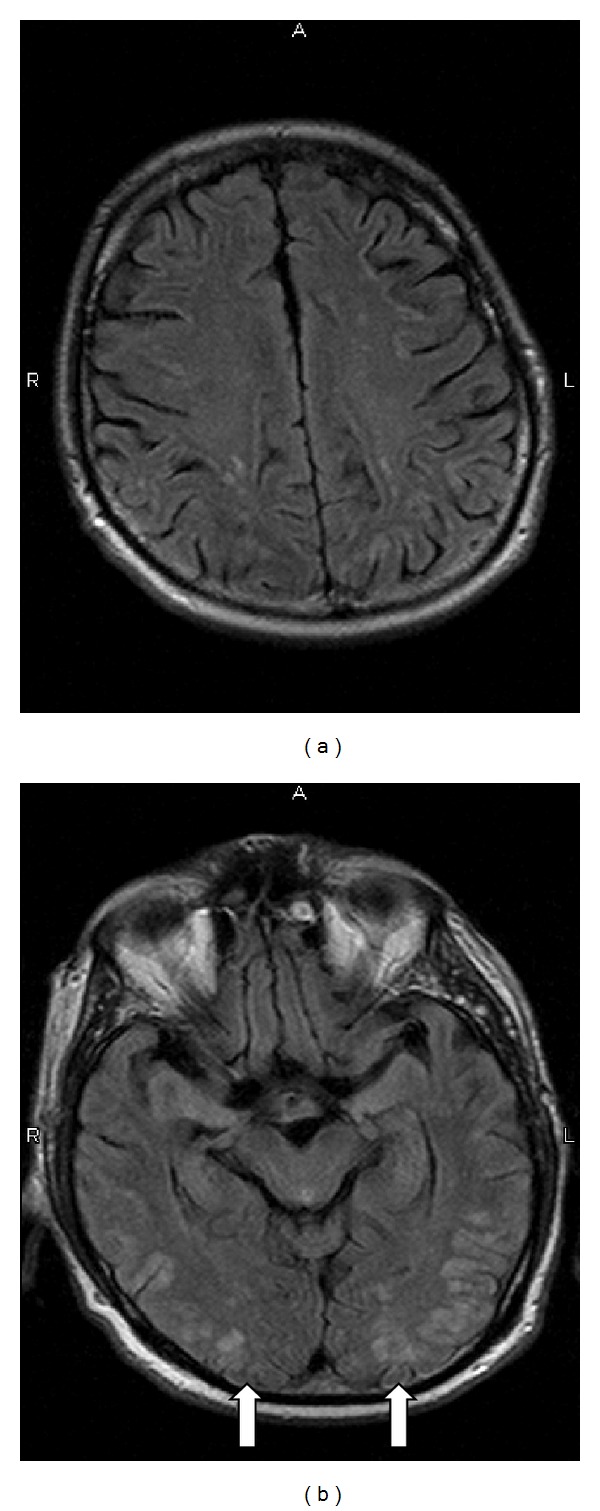
Brain-lesion imaging with accompanying fungal pathology in the source case.
treatment example · Fig. 1

Brain-lesion imaging with accompanying fungal pathology in the source case.

Original context: Ibrutinib-exposed CLL patient.

The complete original figure includes both radiology and histopathology.

Le Thuy-Hong, Kumar Vikas, Gondal Khubaib et al.. BMC Infect Dis. 2020 Feb 24;20:175. doi: 10.1186/s12879-020-4894-2. Fig. 1.
Isolated central nervous system Aspergillosis infection in a chronic lymphocytic leukemia patient on Ibrutinib: A case report

Original figure & article ↗ · CC BY 4.0 ↗

None. Original figure, unmodified; all published panels and annotations retained.

Used in: CNS fungal infection during ibrutinib exposure

File provenance

Source: PubMed Central / U.S. National Library of Medicine. Retrieved 2026-10-28 Retrieved from the official PMC Open Access dataset. This stored copy may not include later source updates. No NLM endorsement.

SHA-256: a0c54b682d95350848c15035f2cdc27e4ad96f1bb0bb14366951f0f970269036

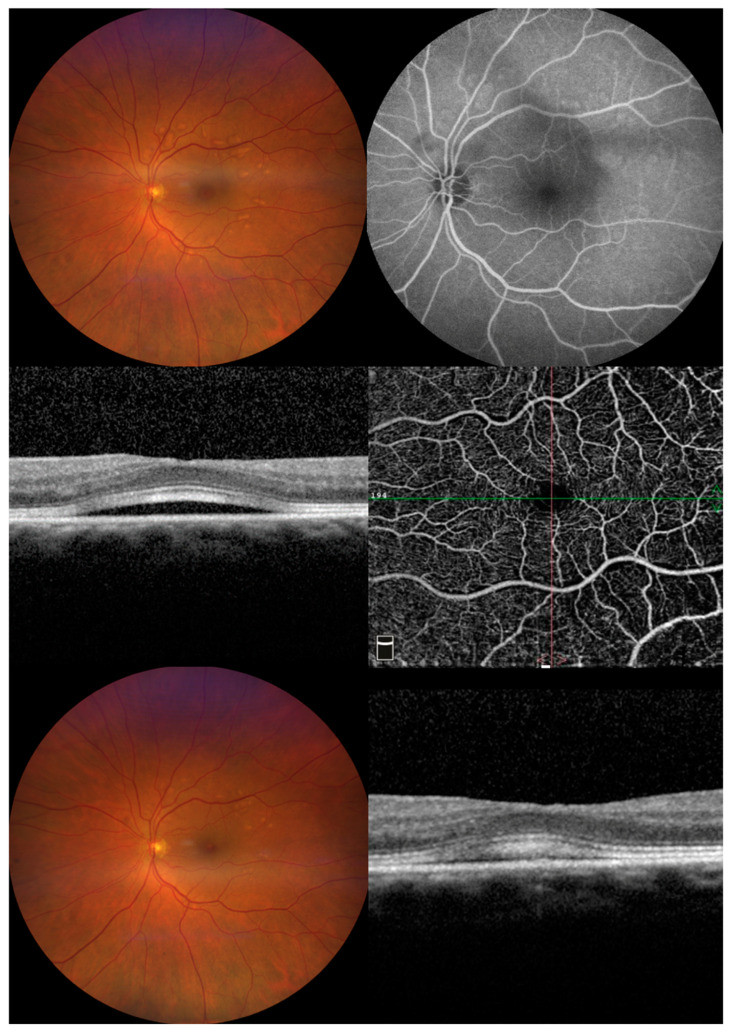
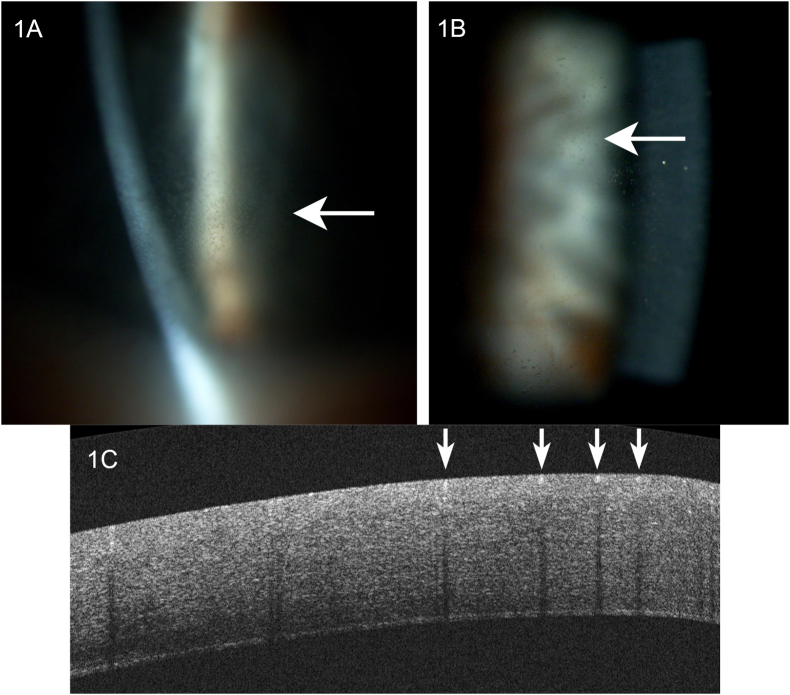
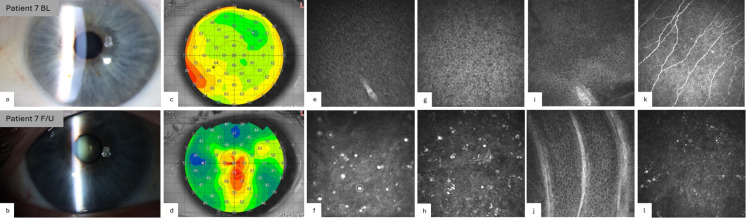
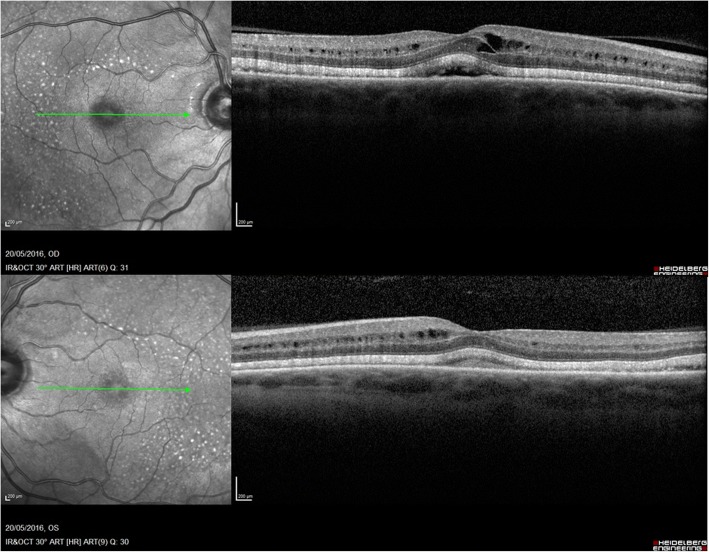
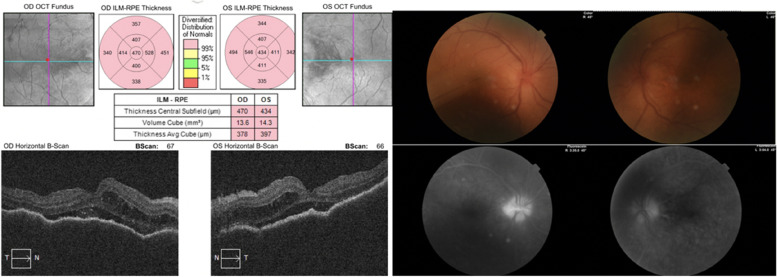
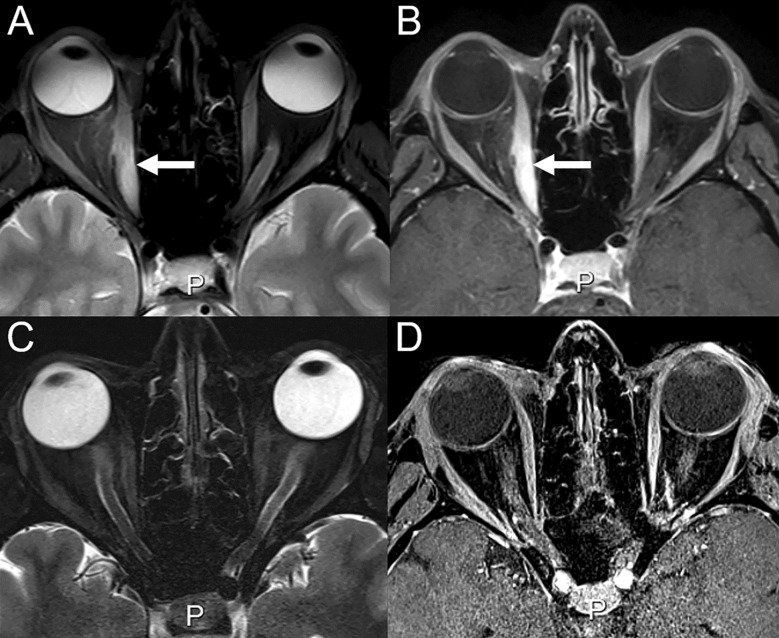
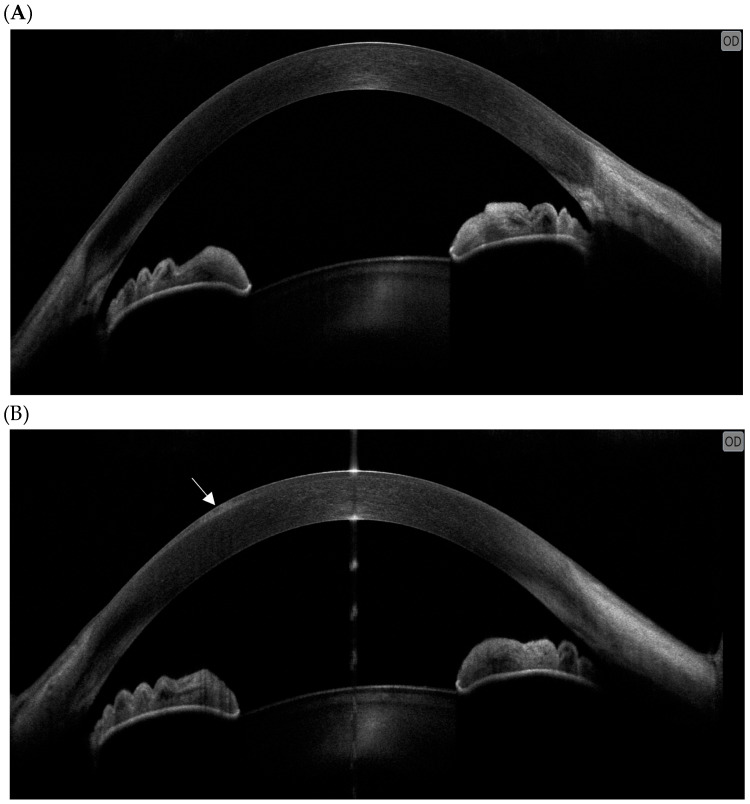
Ophthalmic imaging including OCT in the source MEK-associated retinopathy case.
treatment example · Figure 1

Ophthalmic imaging including OCT in the source MEK-associated retinopathy case.

Original context: Trametinib plus dabrafenib.

Combination exposure; not proof of single-agent causality.

Fasolino Giuseppe, Awada Gil, Moschetta Laura et al.. J Clin Med. 2023 Feb 3;12(3):1214. doi: 10.3390/jcm12031214. Figure 1.
Assessment of Retinal Pigment Epithelium Alterations and Chorioretinal Vascular Network Analyses in Patients under Treatment with BRAF/MEK Inhibitor for Different Malignancies: A Pilot Study

Original figure & article ↗ · CC BY 4.0 ↗

None. Original figure, unmodified; all published panels and annotations retained.

Used in: Retinal pigment epithelial detachment on trametinib

File provenance

Source: PubMed Central / U.S. National Library of Medicine. Retrieved 2026-10-28 Retrieved from the official PMC Open Access dataset. This stored copy may not include later source updates. No NLM endorsement.

SHA-256: 90aaeaa8c32ac6736b02030130a61a4556a6f298e64df515f97a87507180fa7d

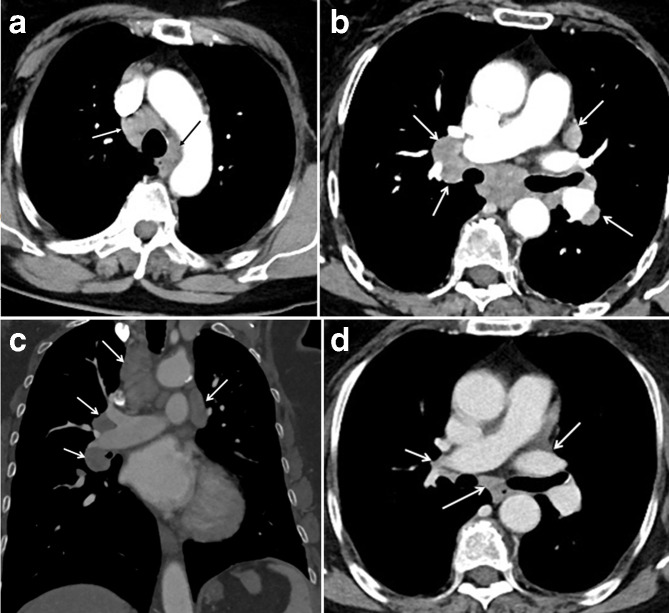
CT hilar/mediastinal sarcoid-like lymphadenopathy.
treatment example · Figure 1.

CT hilar/mediastinal sarcoid-like lymphadenopathy.

Original context: Adjuvant ipilimumab in melanoma.

Garanzini Enrico Matteo, Scaramuzza Davide, Spadarella Gaia et al.. BJR Case Rep. 2020 Sep 29;6(2):20190065. doi: 10.1259/bjrcr.20190065. Figure 1..
Sarcoidosis-like disease mimicking metastases during adjuvant ipilimumab therapy in advanced melanoma patient: CT scan and MRI help in managing difficult clinical decision

Original figure & article ↗ · CC BY 4.0 ↗

None. Original figure, unmodified; all published panels and annotations retained.

Used in: Sarcoid-like thoracic lymphadenopathy

File provenance

Source: PubMed Central / U.S. National Library of Medicine. Retrieved 2026-10-28 Retrieved from the official PMC Open Access dataset. This stored copy may not include later source updates. No NLM endorsement.

SHA-256: 200f69f63059f6f5cf996c5a1572c7379f2d0c31a7efc3196e8b632110b8a2aa

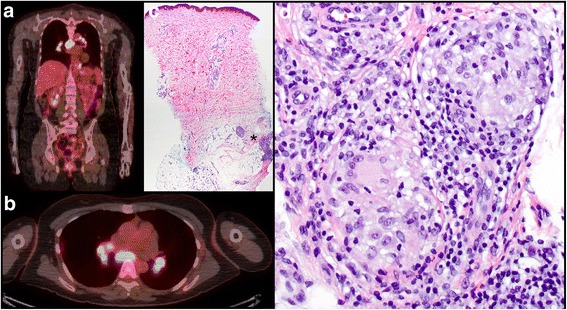
FDG-avid hilar/mediastinal nodes in source patient 2.
treatment example · Fig. 2

FDG-avid hilar/mediastinal nodes in source patient 2.

Original context: Adjuvant ipilimumab.

Full original figure includes clinical/pathology correlation where present. Three source figures identify three different patients.

Tetzlaff Michael T., Nelson Kelly C., Diab Adi et al.. J Immunother Cancer. 2018 Feb 12;6:14. doi: 10.1186/s40425-018-0323-0. Fig. 2.
Granulomatous/sarcoid-like lesions associated with checkpoint inhibitors: a marker of therapy response in a subset of melanoma patients

Original figure & article ↗ · CC BY 4.0 ↗

None. Original figure, unmodified; all published panels and annotations retained.

Used in: Sarcoid-like thoracic lymphadenopathy

File provenance

Source: PubMed Central / U.S. National Library of Medicine. Retrieved 2026-10-28 Retrieved from the official PMC Open Access dataset. This stored copy may not include later source updates. No NLM endorsement.

SHA-256: 93d61912f8a4f4aa016451d20d7f66ac2425ab36042746f1930727887b45949a

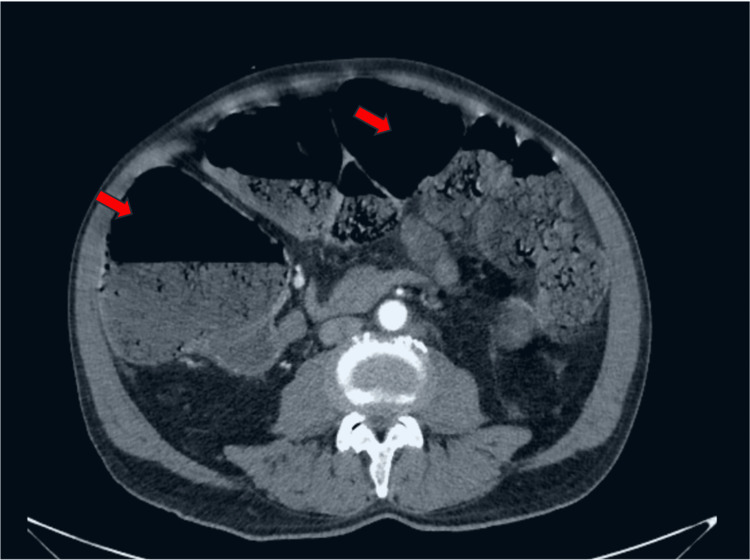
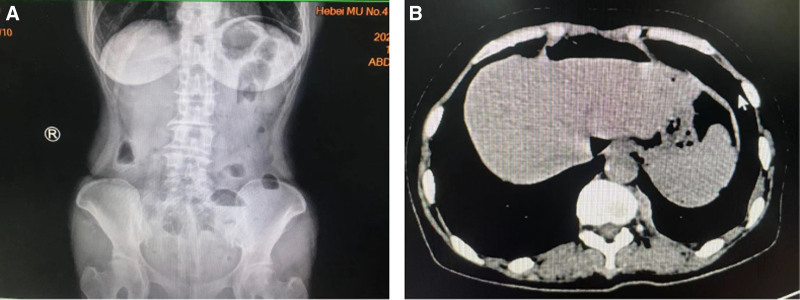
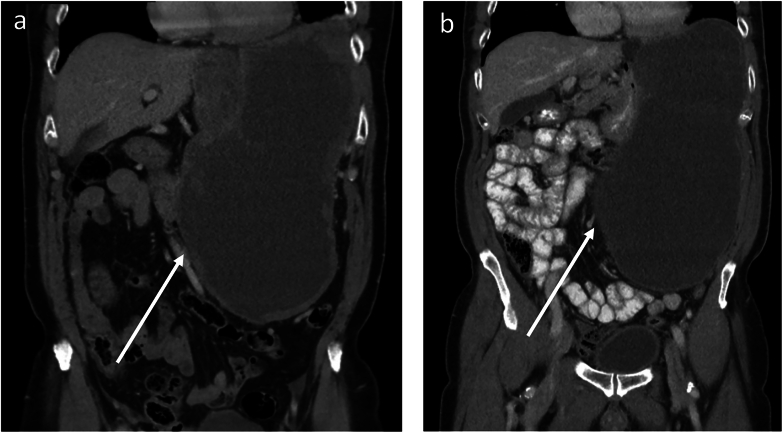
CT bowel dilatation in intestinal pseudo-obstruction.
treatment example · Figure 2

CT bowel dilatation in intestinal pseudo-obstruction.

Original context: Vincristine-containing combination treatment.

One case; radiograph Figure 1 is the same patient. Other contributors and mechanical obstruction require clinical assessment.

Monteiro Miguel, Castanheira Beatriz, Meireles Elsa et al.. Cureus. 2024 Nov 22;16(11):e74213. doi: 10.7759/cureus.74213. Figure 2.
Intestinal Pseudo-Obstruction After Vincristine Use

Original figure & article ↗ · CC BY 4.0 ↗

None. Original figure, unmodified; all published panels and annotations retained.

Used in: Vincristine-associated ileus / pseudo-obstruction

File provenance

Source: PubMed Central / U.S. National Library of Medicine. Retrieved 2026-10-28 Retrieved from the official PMC Open Access dataset. This stored copy may not include later source updates. No NLM endorsement.

SHA-256: d17988c48942def47c745c2359fed66f9c0ee6a0241c819b415134a4e98875fb

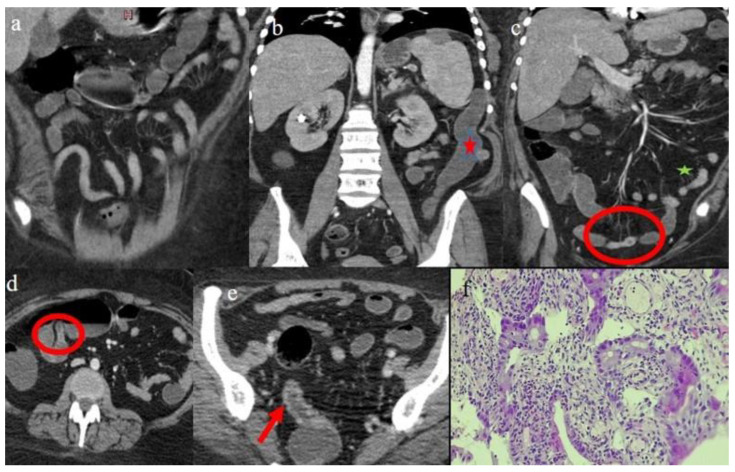
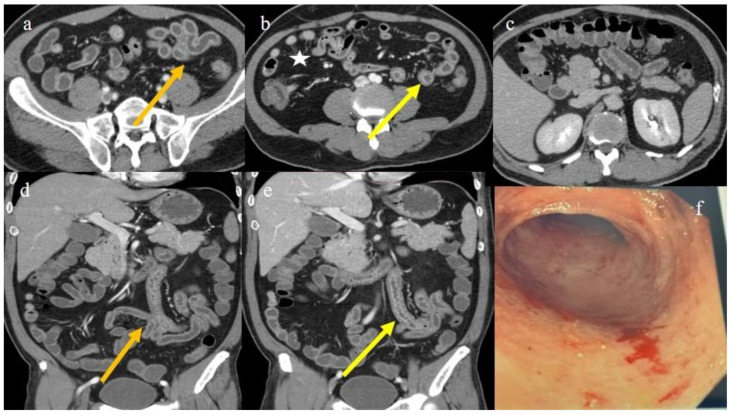
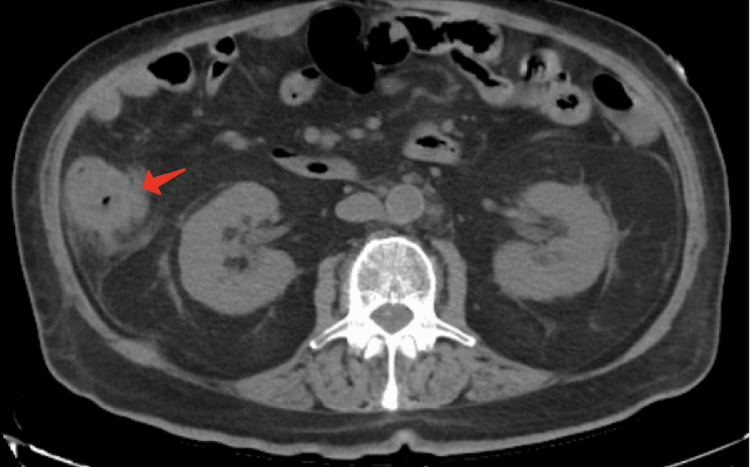
CT terminal-ileal mural inflammation.
treatment example · Figure 2

CT terminal-ileal mural inflammation.

Original context: Capecitabine-containing treatment.

Klimko Artsiom, Tieranu Cristian G, Olteanu Andrei O et al.. Cureus. 2021 Apr 21;13(4):e14621. doi: 10.7759/cureus.14621. Figure 2.
Capecitabine-Induced Terminal Ileitis: Case Report and Literature Review

Original figure & article ↗ · CC BY 3.0 ↗

None. Original figure, unmodified; all published panels and annotations retained.

Used in: Capecitabine-associated ileitis

File provenance

Source: PubMed Central / U.S. National Library of Medicine. Retrieved 2026-10-28 Retrieved from the official PMC Open Access dataset. This stored copy may not include later source updates. No NLM endorsement.

SHA-256: b656e61758d10d4e76c9c54e865a72c829ddfe8cad431063dc969fe2ee6d0cad

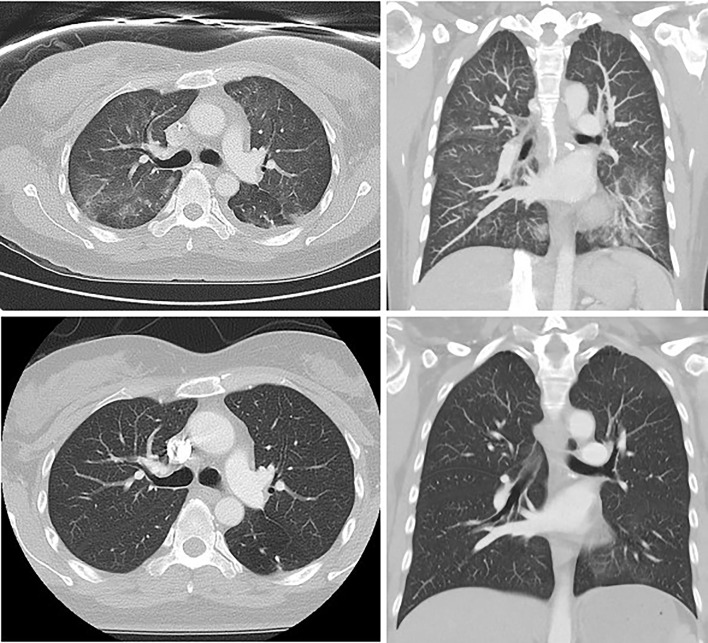
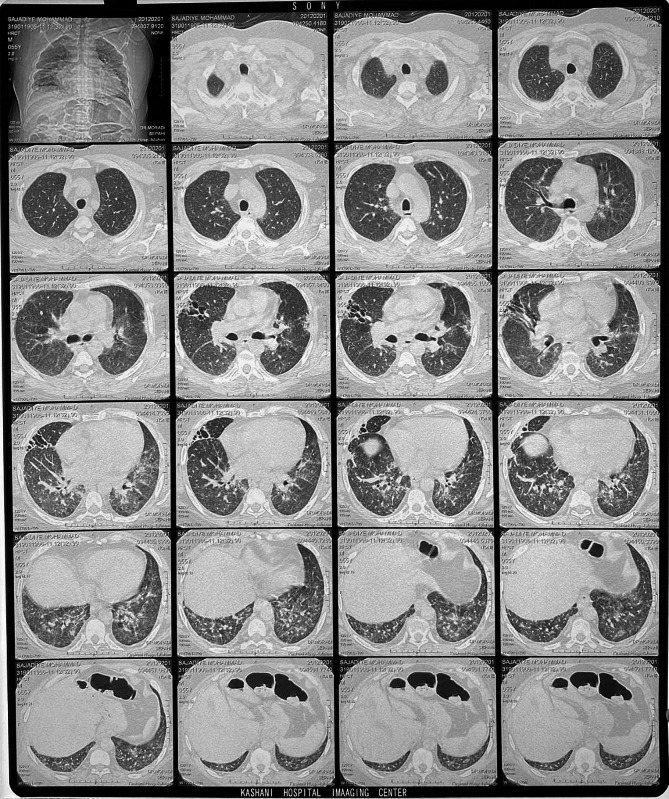
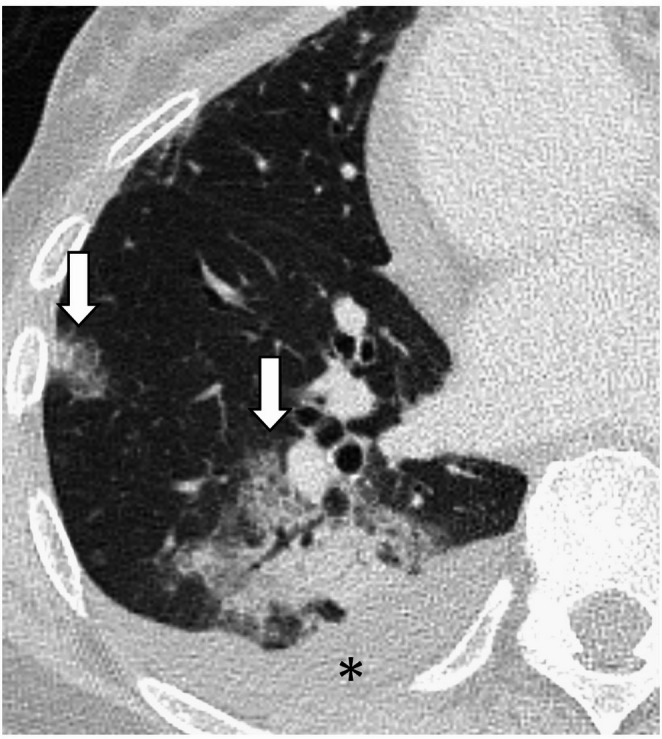
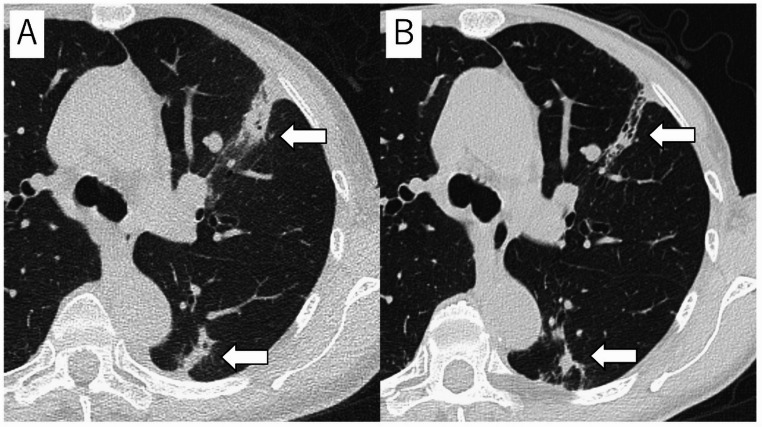
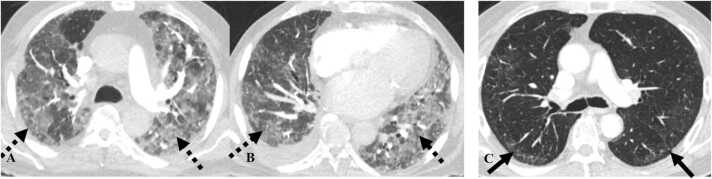
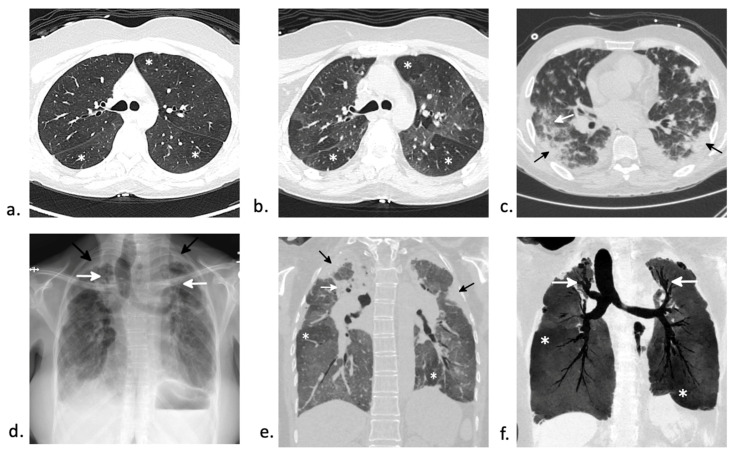
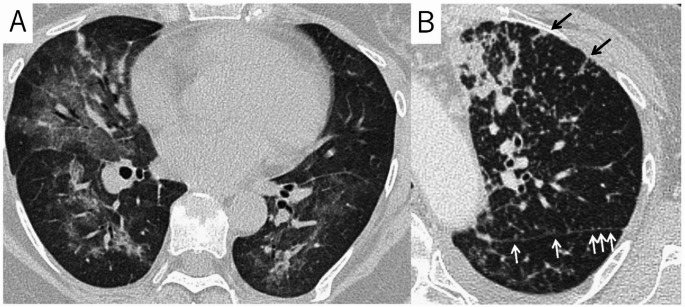
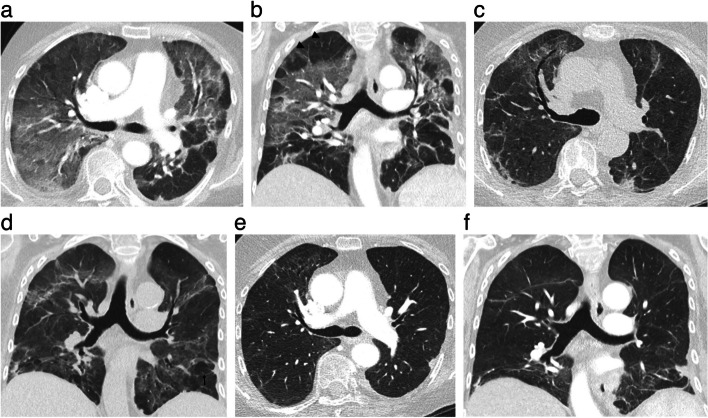
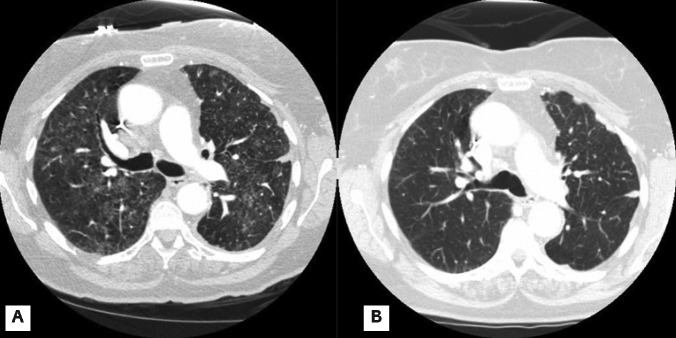
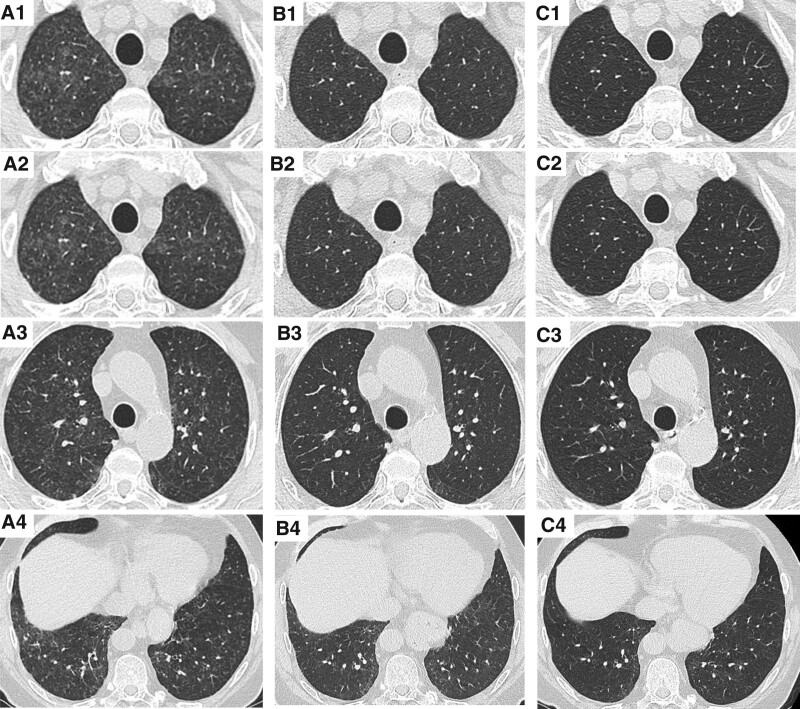
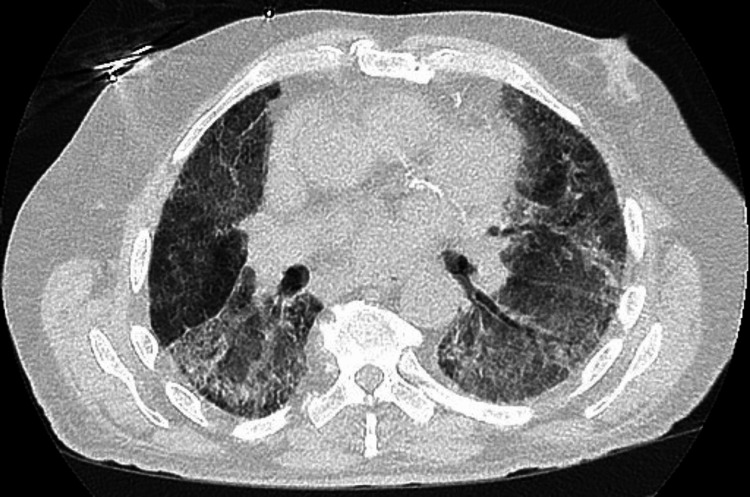
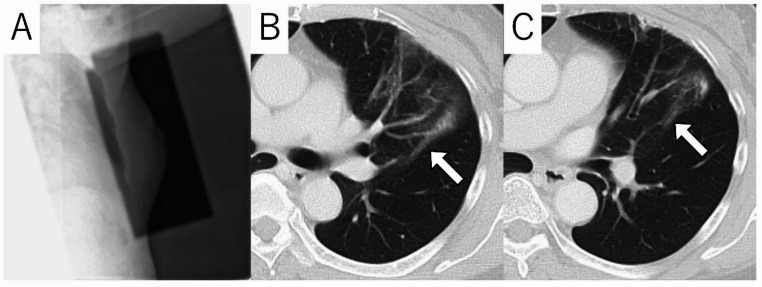
Serial HRCT of one paclitaxel-associated pneumonitis patient with ground-glass change and traction bronchiectasis.
pattern example · Figure 2

Serial HRCT of one paclitaxel-associated pneumonitis patient with ground-glass change and traction bronchiectasis.

Original context: Paclitaxel after doxorubicin/cyclophosphamide for breast cancer; source patient 4.

All serial panels are one patient. This original Figure 2 is reusable; the same article's Figure 1 contains Radiopaedia courtesy images and is excluded. Caption/patient-table pattern naming is inconsistent; no definitive OP-versus-NSIP label assigned.

Ardolino Luke, Lau Brandon, Wilson Isabella et al.. Front Oncol. 2021 Jun 23;11:701424. doi: 10.3389/fonc.2021.701424. Figure 2.
Case Report: Paclitaxel-Induced Pneumonitis in Early Breast Cancer: A Single Institution Experience and Review

Original figure & article ↗ · CC BY 4.0 ↗

None. Original figure, unmodified; all published panels and annotations retained.

Used in: Paclitaxel-associated pneumonitis · Osimertinib-associated ILD / pneumonitis · Abemaciclib-associated ILD / pneumonitis · Alectinib-associated ILD / pneumonitis · Crizotinib-associated lung injury · Enfortumab vedotin-associated pneumonitis · Erlotinib-associated ILD / pneumonitis · Everolimus-related pneumonitis · Gefitinib-associated ILD / pneumonitis · ILD / pneumonitis reported with apalutamide · Olaparib-associated ILD / pneumonitis · Palbociclib-associated ILD / pneumonitis · Pemetrexed-associated interstitial pneumonitis · Ribociclib-associated ILD / pneumonitis · Temsirolimus-related pneumonitis · Early pulmonary events on brigatinib · Sirolimus-associated pneumonitis · Delayed lung injury after busulfan · Carmustine-associated pulmonary fibrosis · Melphalan-associated pneumonitis / fibrosis

File provenance

Source: PubMed Central / U.S. National Library of Medicine. Retrieved 2026-10-28 Retrieved from the official PMC Open Access dataset. This stored copy may not include later source updates. No NLM endorsement.

SHA-256: 1a614f0986a57d513388e0f74027d200e3672016f8171ed30455c27e8b4bc6f2

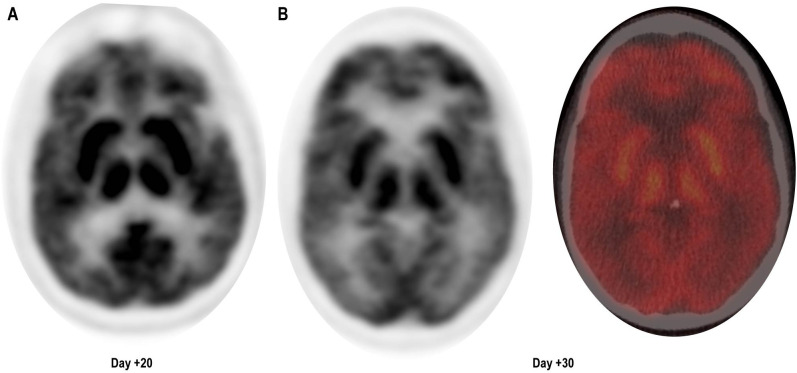
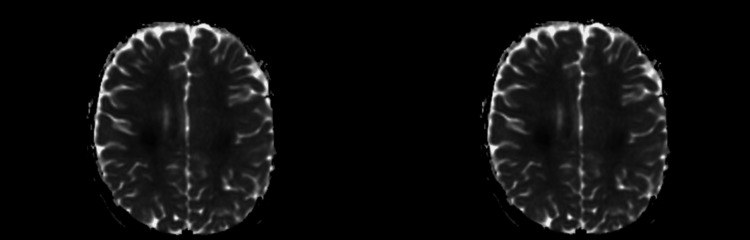
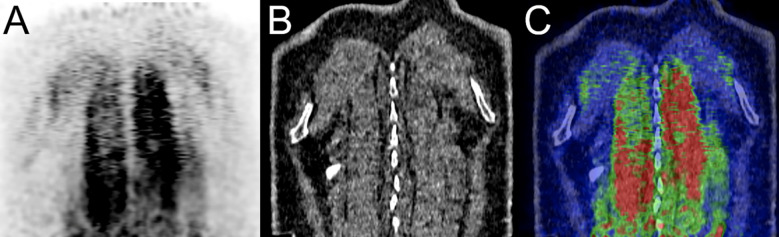
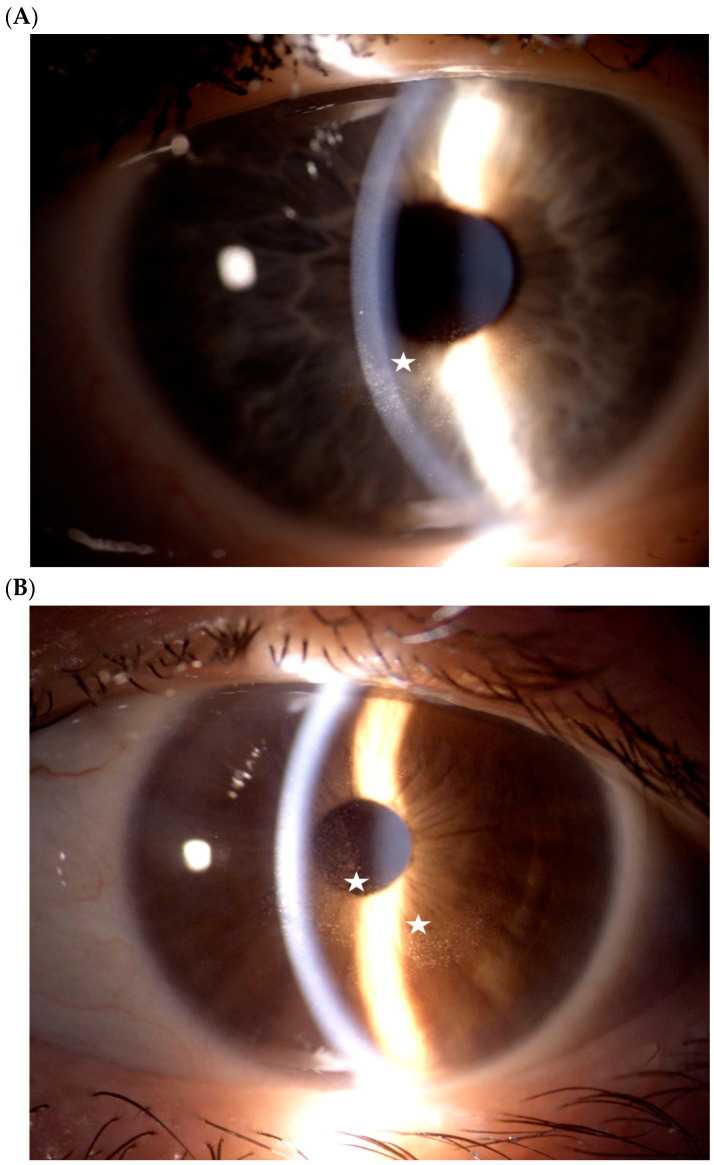
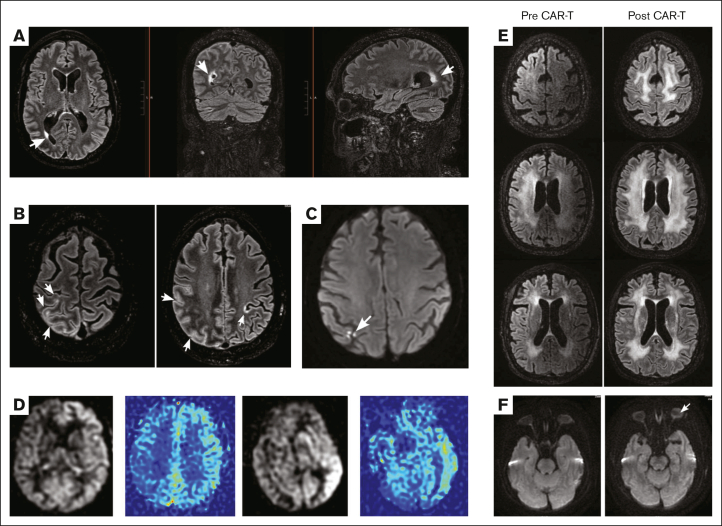
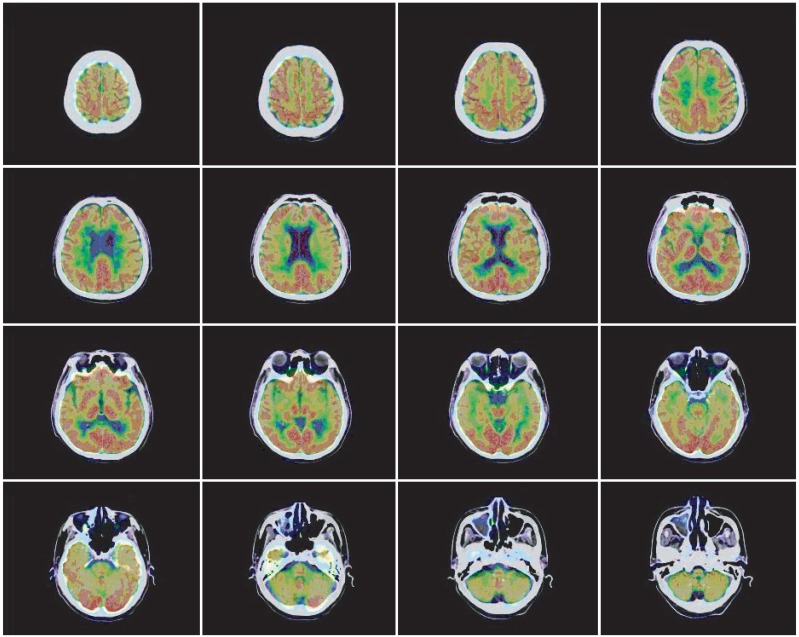
Basal-ganglia and thalamic FDG uptake in the published neurotoxicity case.
treatment example · Figure 1

Basal-ganglia and thalamic FDG uptake in the published neurotoxicity case.

Original context: Ciltacabtagene autoleucel.

An individual case, not a diagnostic PET signature or an ICANS rule-out test.

Aliakbar Raya, Manouvakhova Olga, Wong Cindy et al.. Front Immunol. 2024 Sep 20;15:1444010. doi: 10.3389/fimmu.2024.1444010. Figure 1.
Case report: Treatment of parkinsonism secondary to ciltacabtagene autoleucel using a combination dopaminergic regimen

Original figure & article ↗ · CC BY 4.0 ↗

None. Original figure, unmodified; all published panels and annotations retained.

Used in: Delayed movement/neurocognitive toxicity after cilta-cel

File provenance

Source: PubMed Central / U.S. National Library of Medicine. Retrieved 2026-10-28 Retrieved from the official PMC Open Access dataset. This stored copy may not include later source updates. No NLM endorsement.

SHA-256: cfd4fd1da3386f254c05c8cdb659bd8d0e4a92c760a5633564596dbeef768870

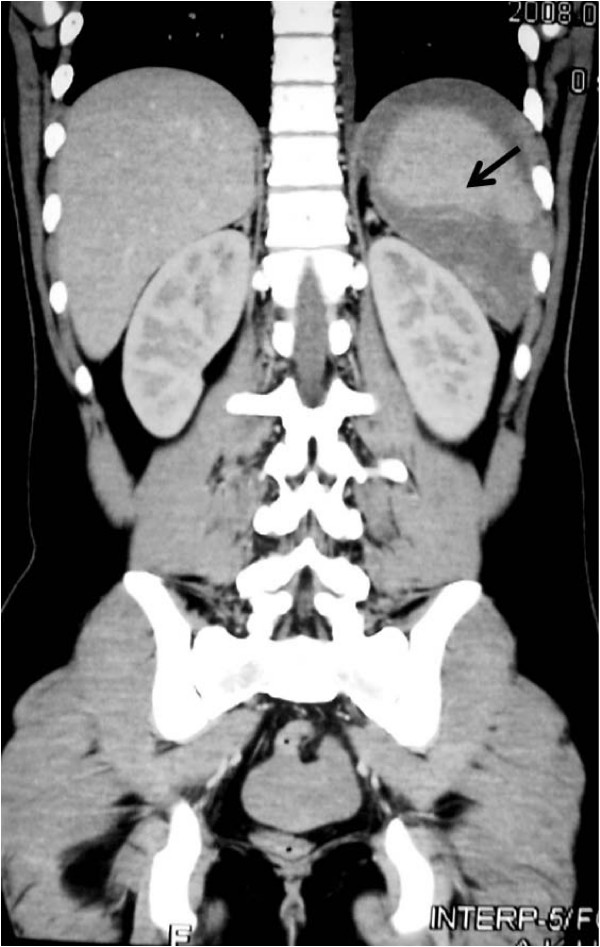
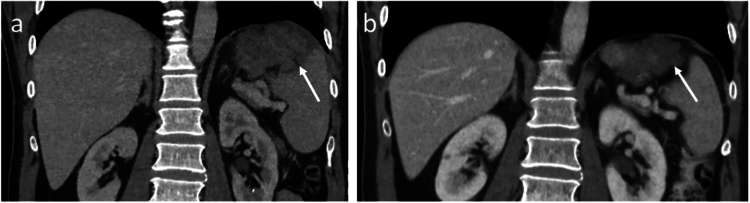
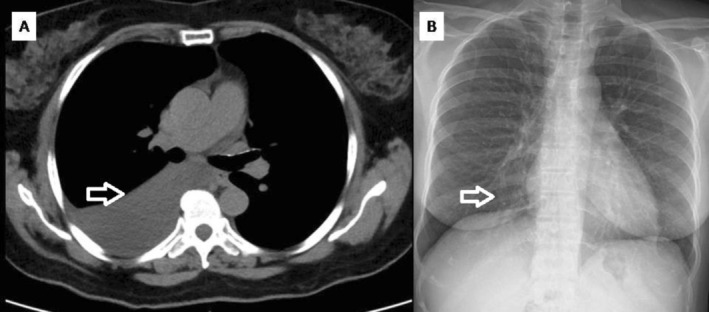
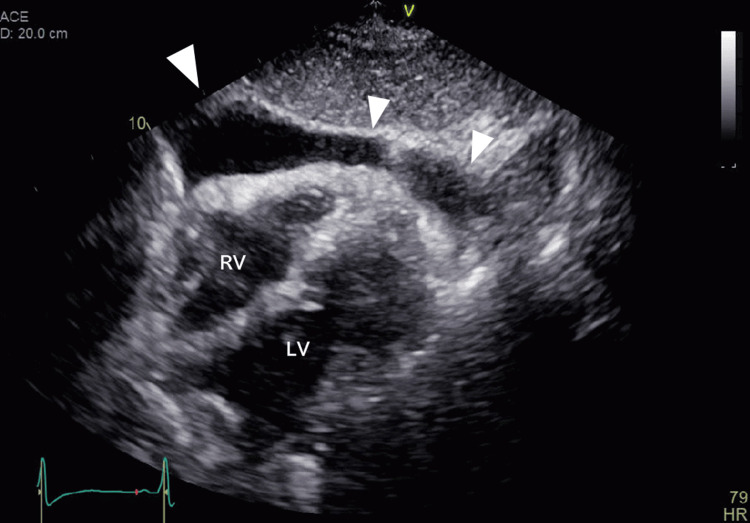
CT perisplenic hemorrhage and splenic rupture.
pattern example · Figure 1

CT perisplenic hemorrhage and splenic rupture.

Original context: G-CSF during hyper-CVAD; formulation not specified.

G-CSF context, not a named-filgrastim example. Histology Figure 2 is not another imaging case.

Masood Nehal, Shaikh Asim Jamal, Memon Wasim Ahmed et al.. Cases J. 2008 Dec 24;1:418. doi: 10.1186/1757-1626-1-418. Figure 1.
Splenic rupture, secondary to G-CSF use for chemotherapy induced neutropenia: a case report and review of literature

Original figure & article ↗ · CC BY 2.0 ↗

None. Original figure, unmodified; all published panels and annotations retained.

Used in: Splenic rupture reported after filgrastim

File provenance

Source: PubMed Central / U.S. National Library of Medicine. Retrieved 2026-10-28 Retrieved from the official PMC Open Access dataset. This stored copy may not include later source updates. No NLM endorsement.

SHA-256: b73fdb11e9c5eac4f866eb8ff908160d4a07dd9b4399b4e8cdf97724ec0a24fe

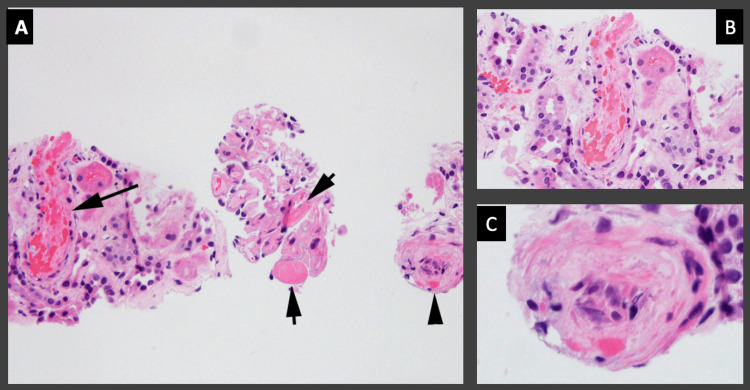
Renal-biopsy example of thrombotic microangiopathy.
pathology correlation · Figure 2

Renal-biopsy example of thrombotic microangiopathy.

Original context: Gemcitabine.

Histopathology, not a CT/MRI diagnostic sign.

Ghumman Ghulam Mujtaba, Fatima Huda, Johnston Tyler L et al.. Cureus. 2022 Aug 26;14(8):e28433. doi: 10.7759/cureus.28433. Figure 2.
Gemcitabine-Induced Thrombotic Microangiopathy Managed Conservatively in a Patient of Breast Cancer

Original figure & article ↗ · CC BY 3.0 ↗

None. Original figure, unmodified; all published panels and annotations retained.

Used in: Gemcitabine-associated thrombotic microangiopathy

File provenance

Source: PubMed Central / U.S. National Library of Medicine. Retrieved 2026-10-28 Retrieved from the official PMC Open Access dataset. This stored copy may not include later source updates. No NLM endorsement.

SHA-256: 5942ec5f9a7c2bbc4829768d4bfcd691b9daa9f80994ae335fe2d2019409c3a3

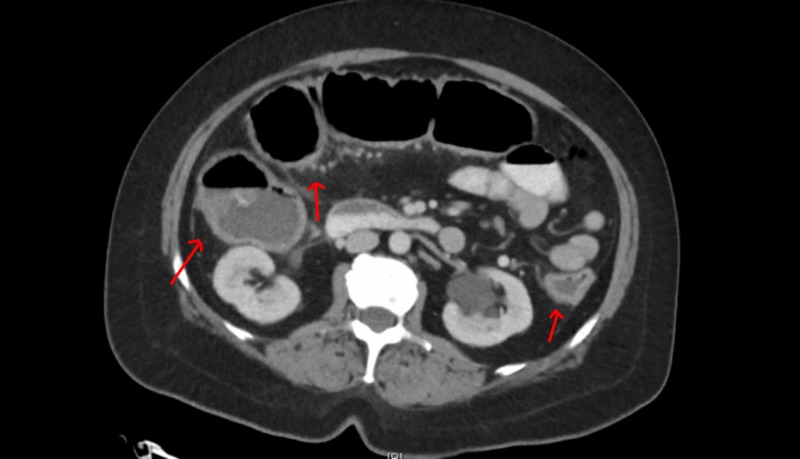
CT pancolitis during combination checkpoint therapy.
treatment example · Figure 1

CT pancolitis during combination checkpoint therapy.

Original context: Nivolumab plus ipilimumab in metastatic melanoma.

Thalambedu Nishanth, Khan Yasir, Zhang Qian et al.. Cureus. 2019 Nov 26;11(11):e6233. doi: 10.7759/cureus.6233. Figure 1.
Immune-mediated Colitis from Dual Checkpoint Inhibitors

Original figure & article ↗ · CC BY 3.0 ↗

None. Original figure, unmodified; all published panels and annotations retained.

Used in: Immune-mediated colitis · Docetaxel-associated enterocolitis · Idelalisib-associated colitis

File provenance

Source: PubMed Central / U.S. National Library of Medicine. Retrieved 2026-10-28 Retrieved from the official PMC Open Access dataset. This stored copy may not include later source updates. No NLM endorsement.

SHA-256: 93cb1287a010b9e0052f611ebf9f86bd5c5cec19c83ba28fb8152354b9244d20

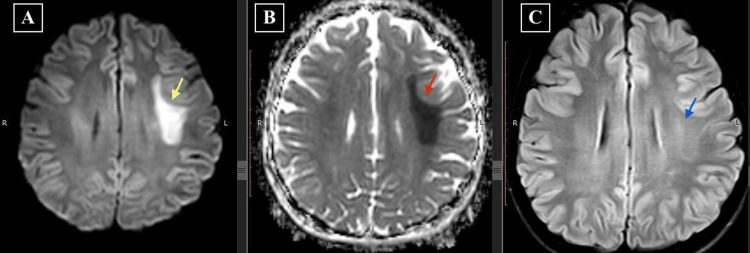
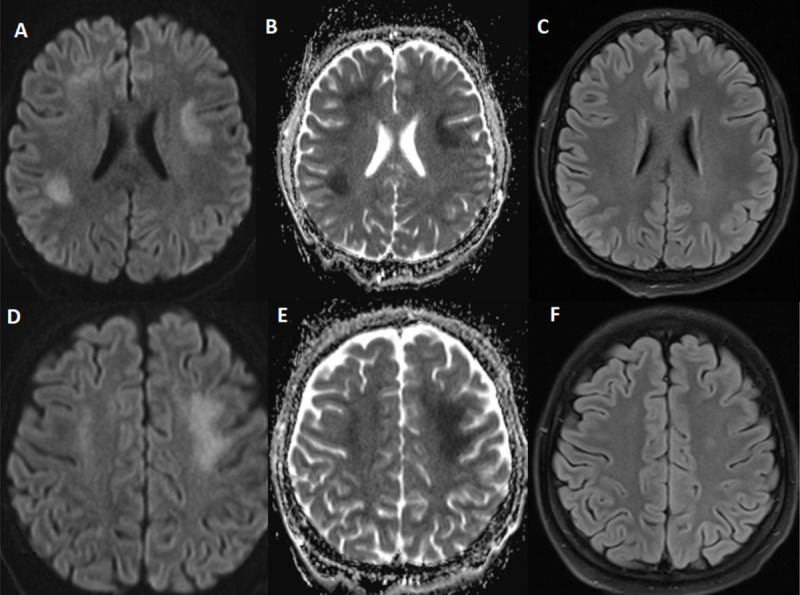
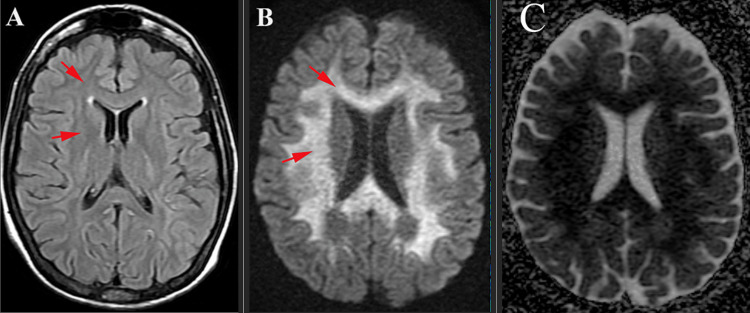
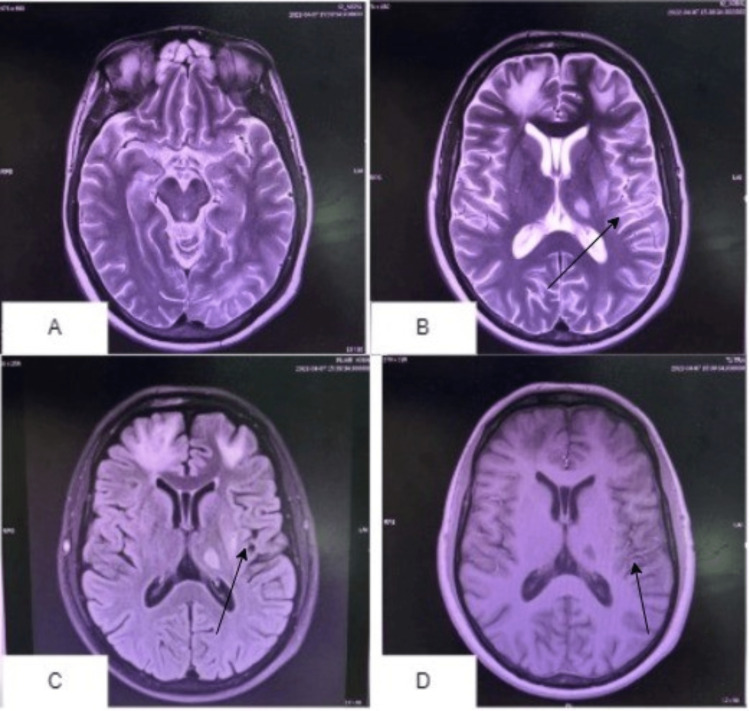
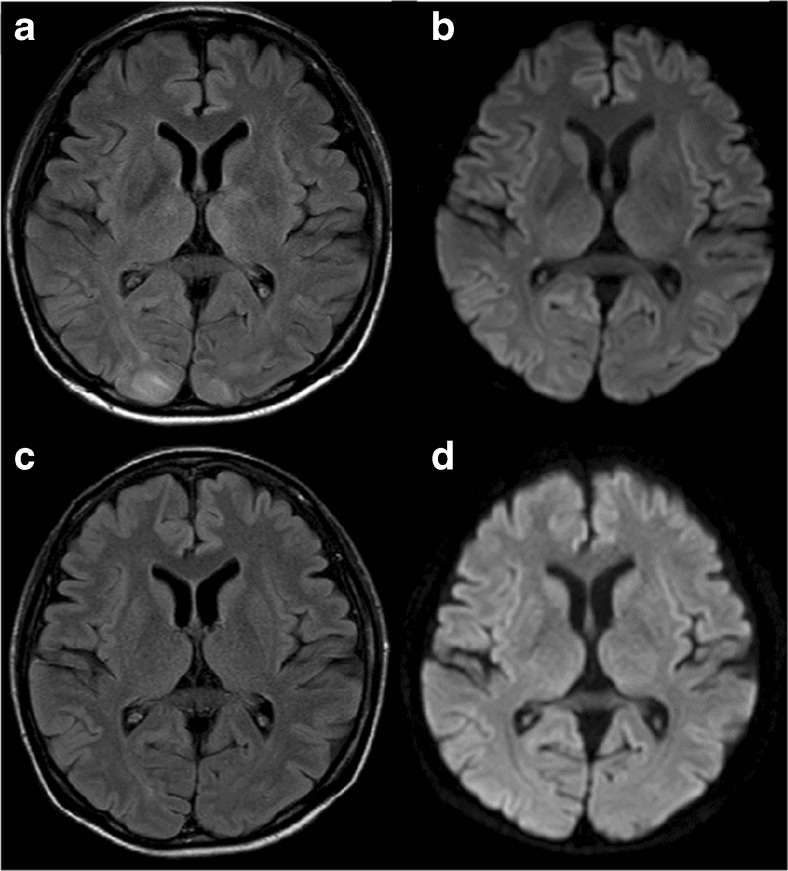
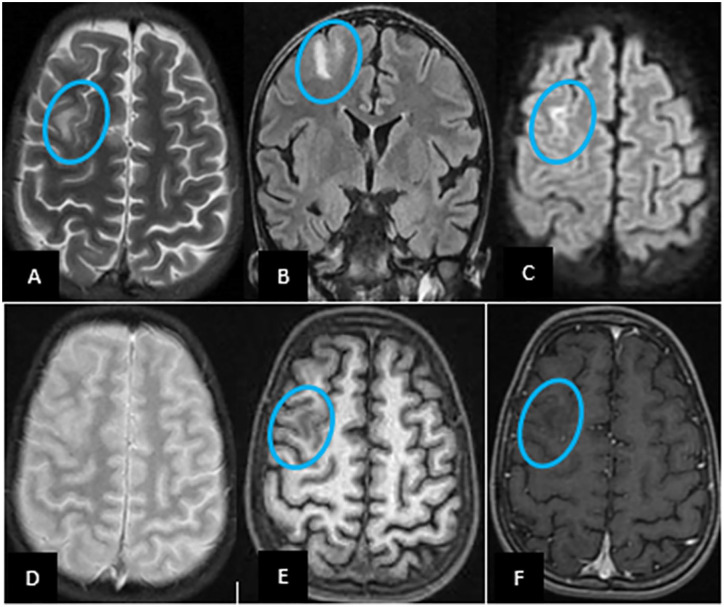
Onset MRI after intrathecal methotrexate within an ALL regimen: left frontal white-matter restriction on DWI/ADC with minimal FLAIR change. This case illustrates a stroke mimic; imaging alone cannot establish the cause.
treatment example · Figure 1

Onset MRI after intrathecal methotrexate within an ALL regimen: left frontal white-matter restriction on DWI/ADC with minimal FLAIR change. This case illustrates a stroke mimic; imaging alone cannot establish the cause.

Original context: B-cell ALL on a Berlin–Frankfurt–Münster combination regimen. Symptoms occurred 12 days after intrathecal methotrexate in induction phase B, which also included cyclophosphamide, cytarabine and mercaptopurine. Case-level MTX attribution.

Source context must be retained. Case illustration; not an independent diagnostic test.

Panicker Vishal V, Radhakrishnan Sunesh E, Kuruttukulam Gigy V et al.. Cureus. 2024 Jan 2;16(1):e51542. doi: 10.7759/cureus.51542. Figure 1.
Methotrexate-Induced Leukoencephalopathy as a Clinical and Radiological Mimicker of Acute Ischemic Stroke Leading to Thrombolysis

Original figure & article ↗ · CC BY 4.0 ↗

None. Original figure, unmodified; all published panels and annotations retained.

Used in: Methotrexate stroke-like neurotoxicity · Delayed fludarabine neurotoxicity · Leukoencephalopathy reported during blinatumomab

File provenance

Source: PubMed Central / U.S. National Library of Medicine. Retrieved 2026-10-28 Retrieved from the official PMC Open Access dataset. This stored copy may not include later source updates. No NLM endorsement.

SHA-256: b59c94c41b93b6ddaeec91b083098a80273b1b86a481c2b23fd8237a78991d2c

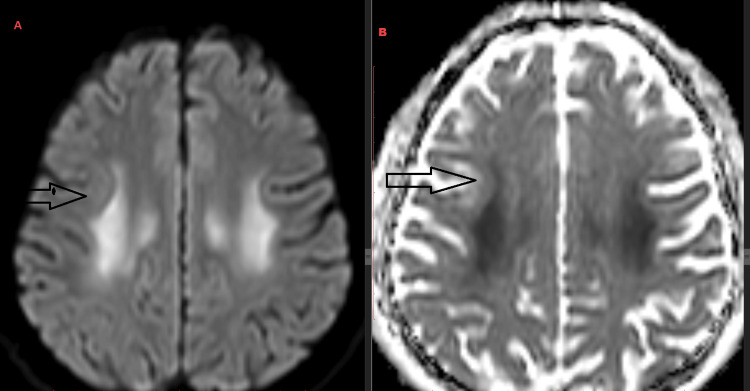
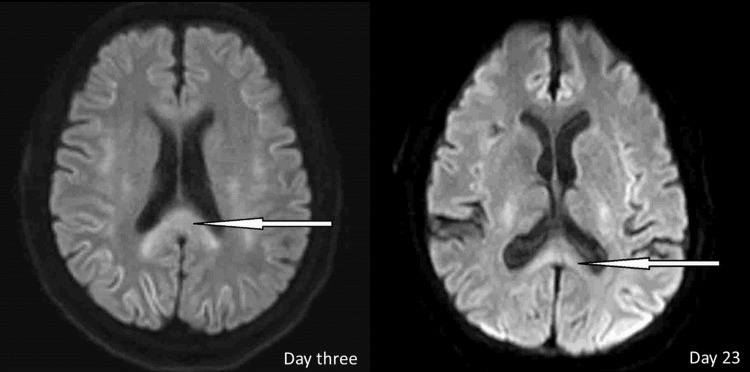
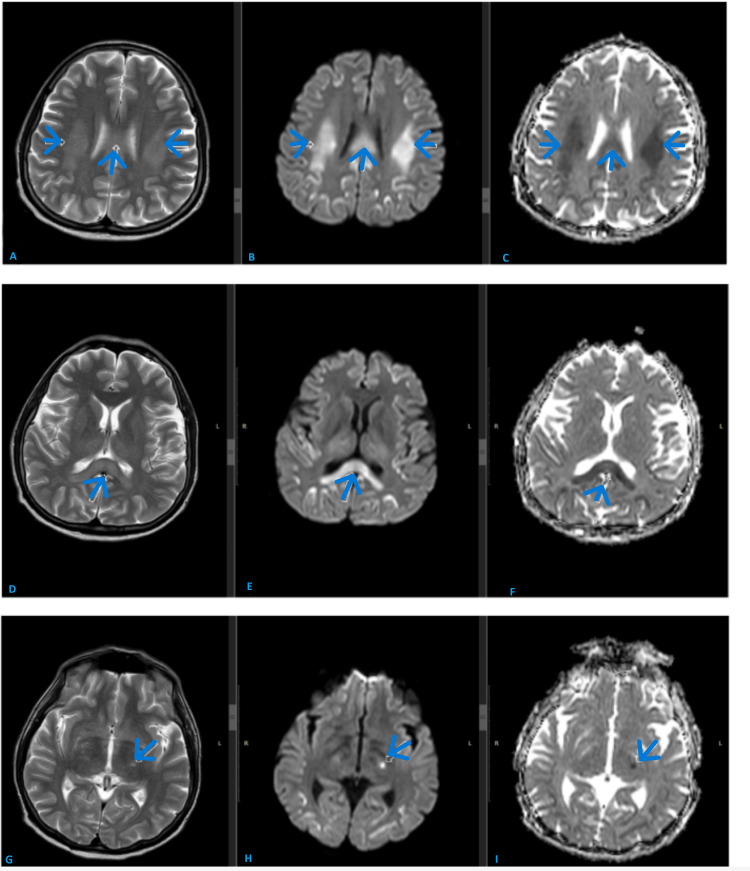
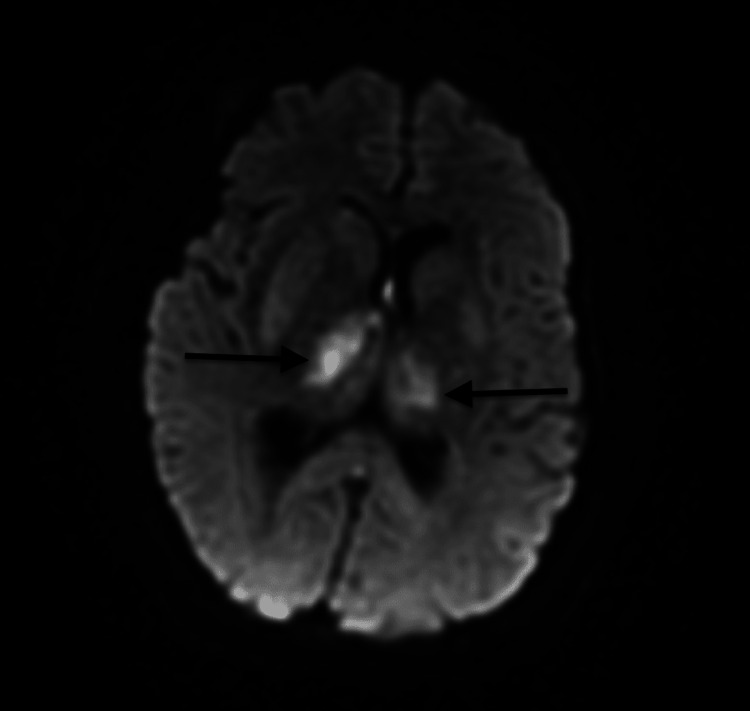
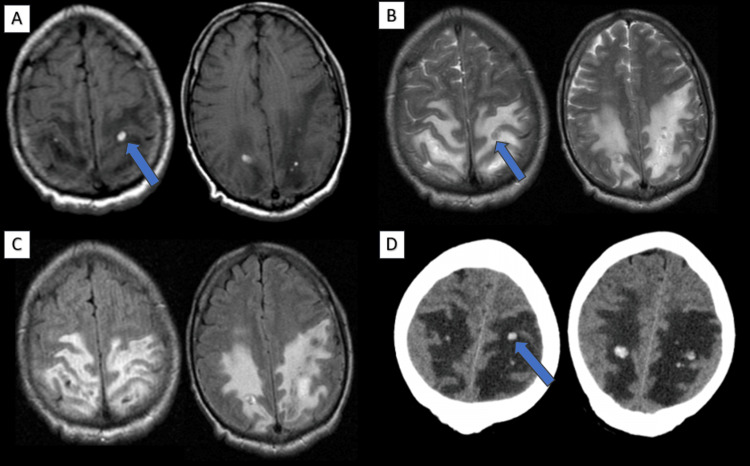
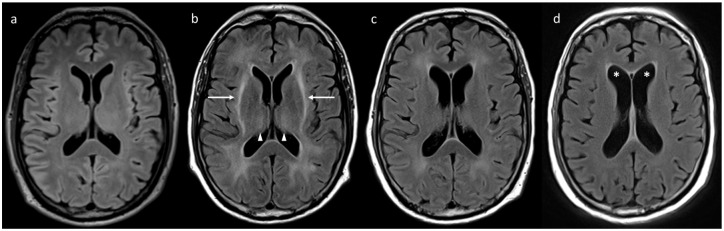
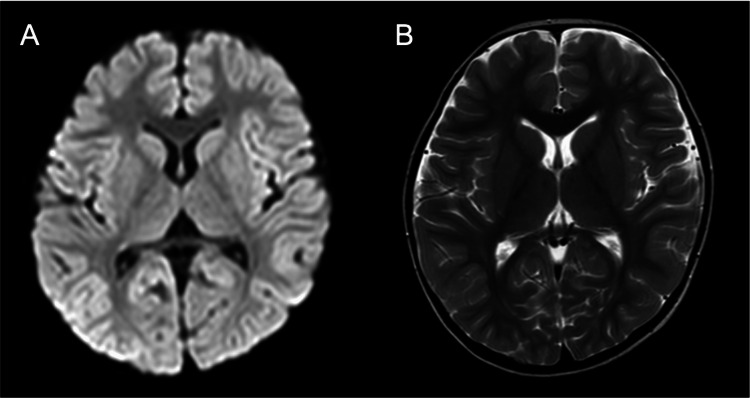
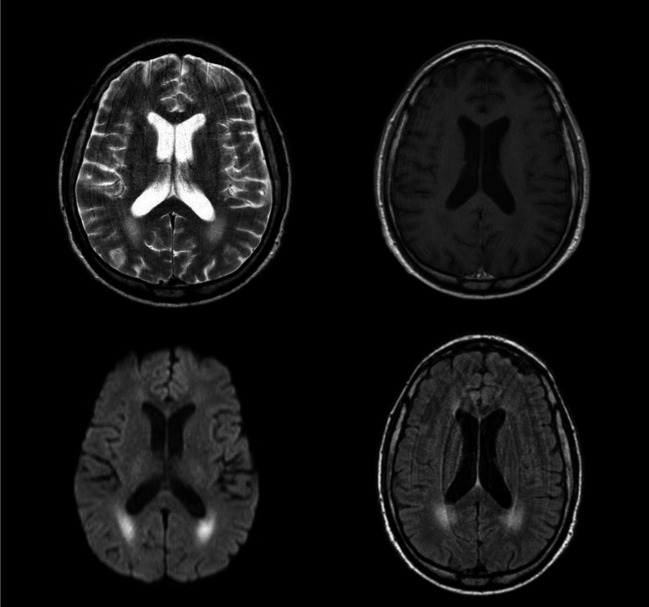
DWI and ADC show symmetric periventricular white-matter restriction during a fluorouracil-containing combination regimen. A case example of toxic leukoencephalopathy, not a drug-specific imaging sign.
treatment example · Figure 2

DWI and ADC show symmetric periventricular white-matter restriction during a fluorouracil-containing combination regimen. A case example of toxic leukoencephalopathy, not a drug-specific imaging sign.

Original context: Colon cancer treated previously with CapeOx, then FOLFOX (folinic acid, fluorouracil, oxaliplatin). Figure 2 follows FOLFOX; later recurrence/worsening occurred during FOLFIRI. Do not label this as single-agent fluorouracil exposure.

Source context must be retained. Case illustration; not an independent diagnostic test.

Ambreen Ambar, Naveed Muhammad Atif, Javed Khalid et al.. Cureus. 2025 Nov 29;17(11):e98058. doi: 10.7759/cureus.98058. Figure 2.
5-Fluorouracil-Induced Acute Toxic Leukoencephalopathy: A Rare Adverse Effect and Its Early Detection on MRI

Original figure & article ↗ · CC BY 4.0 ↗

None. Original figure, unmodified; all published panels and annotations retained.

Used in: 5-FU encephalopathy / leukoencephalopathy

File provenance

Source: PubMed Central / U.S. National Library of Medicine. Retrieved 2026-10-28 Retrieved from the official PMC Open Access dataset. This stored copy may not include later source updates. No NLM endorsement.

SHA-256: 5bfad730c3e2c54dbdd095389781c4b61dea0fa8e04e902c5ef1fd9b42b5fa1e

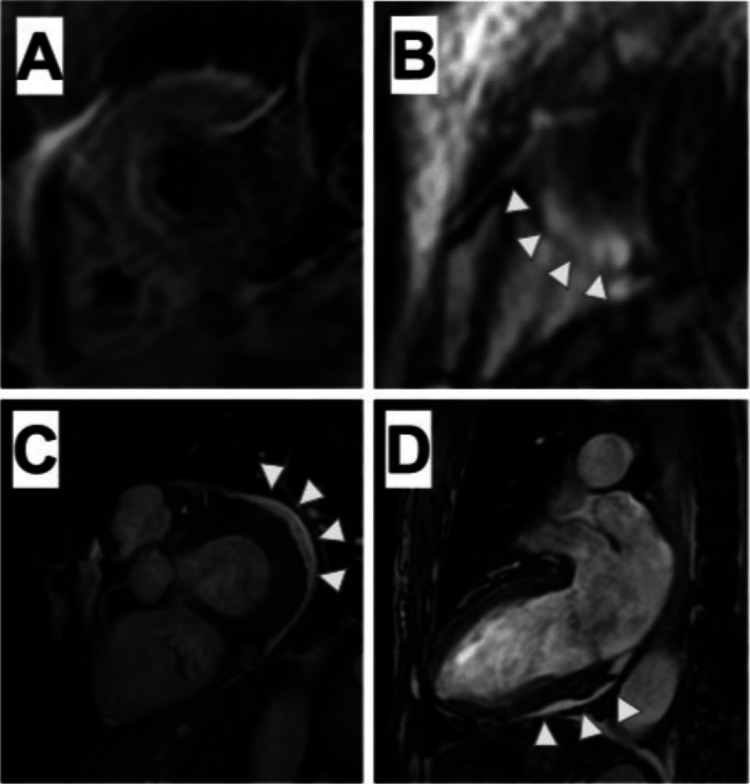
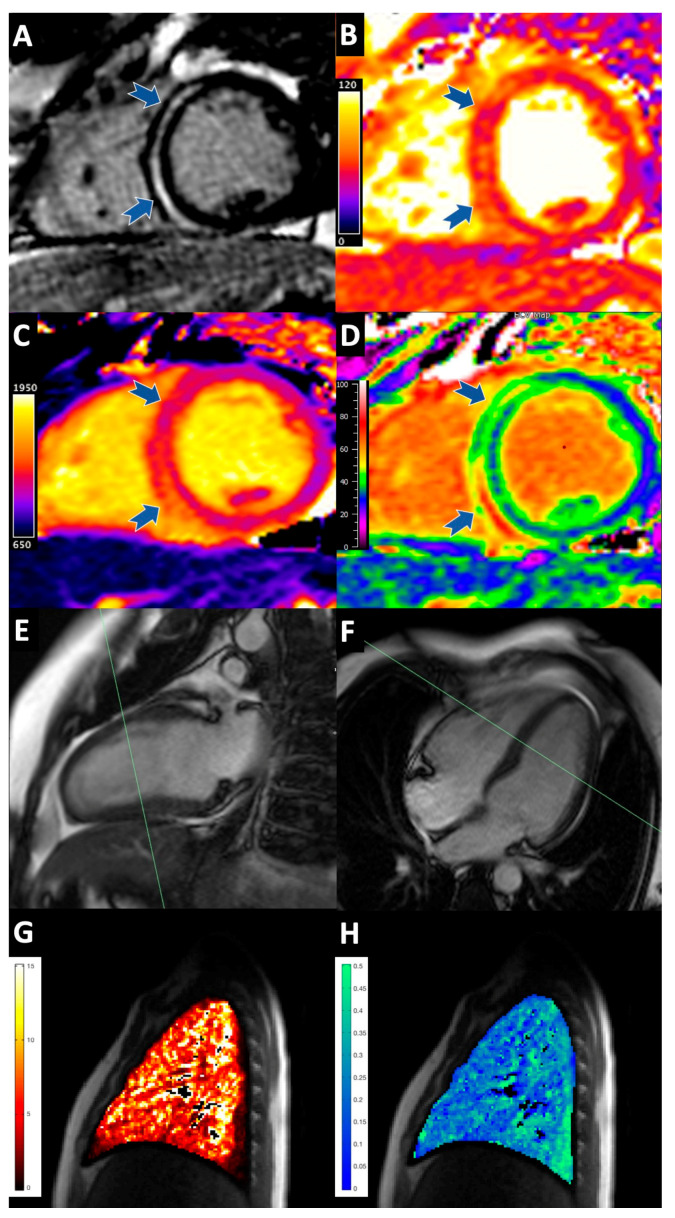
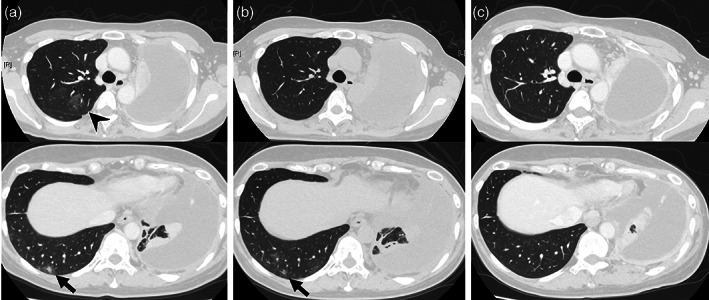
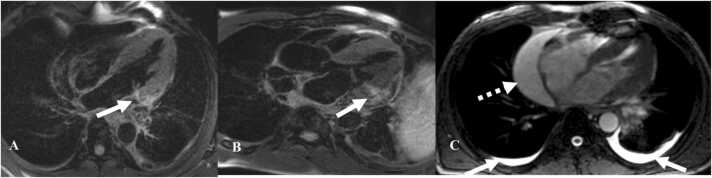
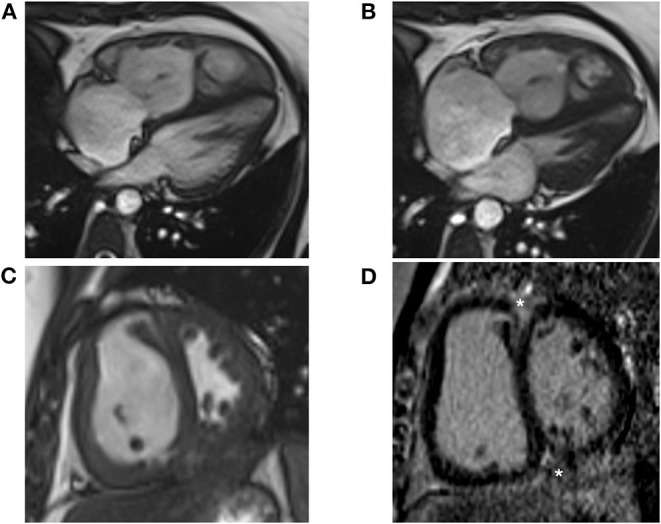
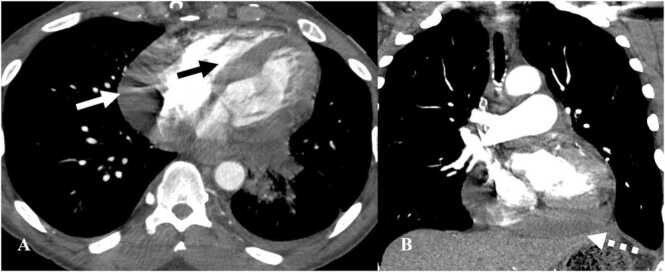
CMR in one nivolumab patient with mild septal LGE and no overt T2 edema.
pattern example · Figure 5

CMR in one nivolumab patient with mild septal LGE and no overt T2 edema.

Original context: Nivolumab for renal-cell carcinoma; concurrent ILD.

Exact ICI context on myocarditis card. On the cyclophosphamide card, myocardial-injury pattern only; this is not a cyclophosphamide case.

Fukushima Shuntaro, Okamoto Eisuke, Uchida Toshihiko et al.. Cureus. 2025 Mar 17;17(3):e80732. doi: 10.7759/cureus.80732. Figure 5.
A Case of Nivolumab-Induced Multiorgan Toxicity: Concurrent Myocarditis and Interstitial Pneumonia

Original figure & article ↗ · CC BY 4.0 ↗

None. Original figure, unmodified; all published panels and annotations retained.

Used in: ICI myocarditis: a normal CMR does not exclude it · Cyclophosphamide-associated myocardial / pericardial injury

File provenance

Source: PubMed Central / U.S. National Library of Medicine. Retrieved 2026-10-28 Retrieved from the official PMC Open Access dataset. This stored copy may not include later source updates. No NLM endorsement.

SHA-256: 04ff73662dd934f7d4552f44b6897231a1a7cca77dc1b546d4fe491e6925b2a8

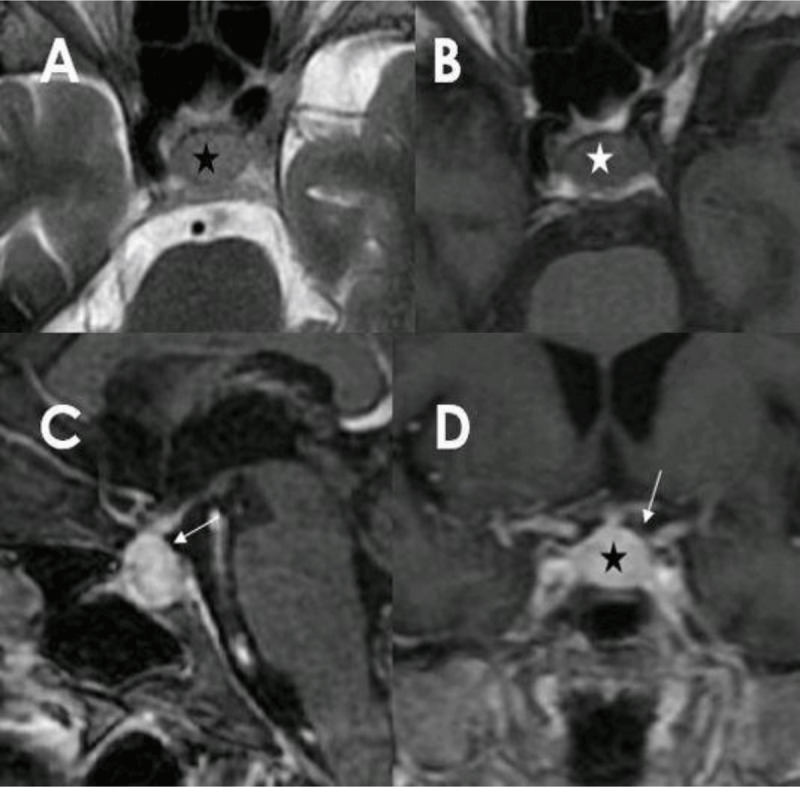
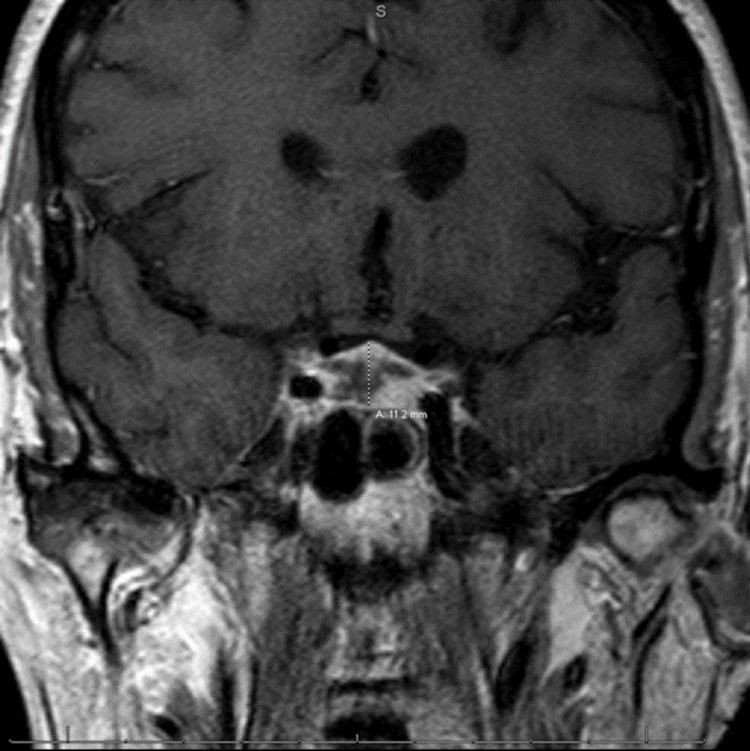
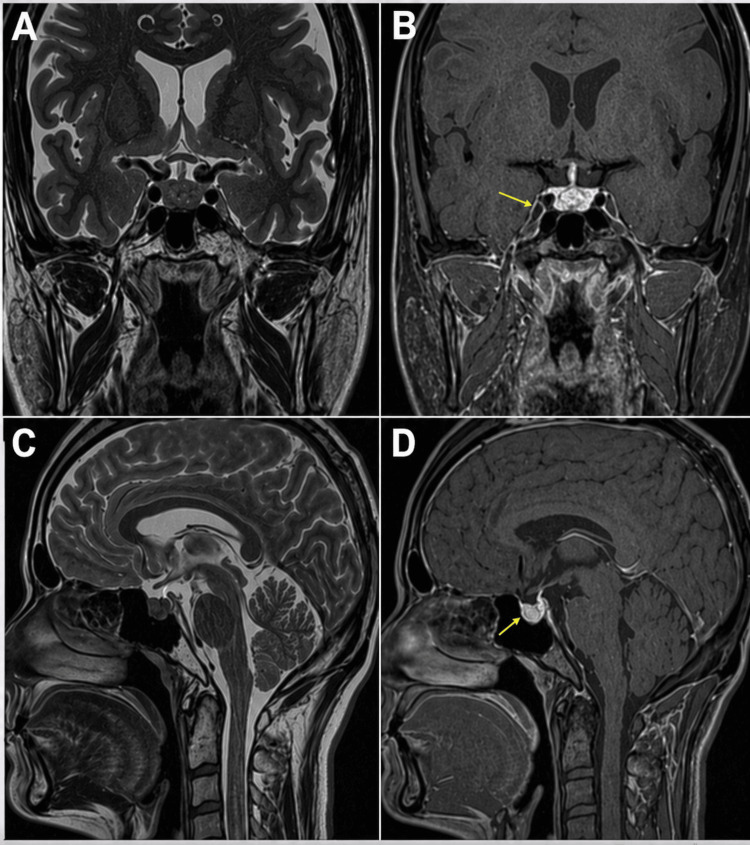
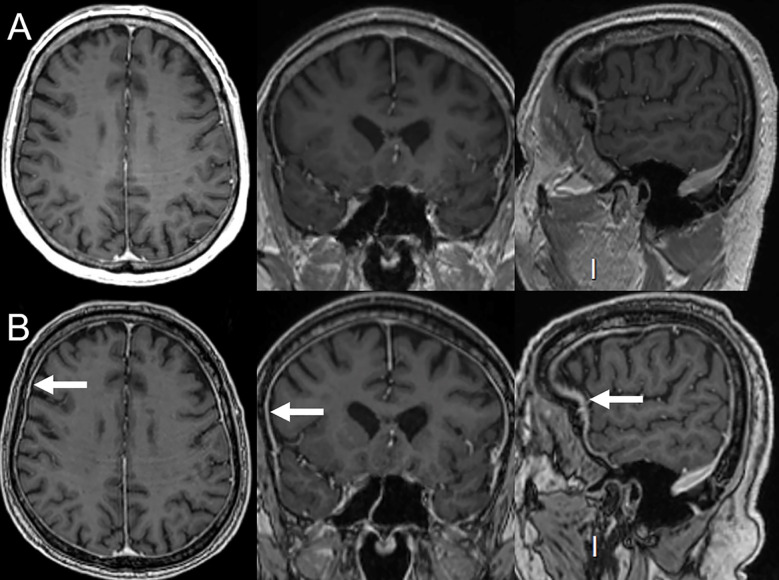
Pituitary MRI during nivolumab–ipilimumab treatment: symmetric gland enlargement, homogeneous enhancement and non-nodular stalk thickening in a reported hypophysitis case.
treatment example · Figure 1

Pituitary MRI during nivolumab–ipilimumab treatment: symmetric gland enlargement, homogeneous enhancement and non-nodular stalk thickening in a reported hypophysitis case.

Original context: Nivolumab plus ipilimumab for metastatic clear-cell renal carcinoma. Although the title emphasizes ipilimumab, the depicted patient had combination exposure.

Source context must be retained. Case illustration; not an independent diagnostic test.

Stagnetto Margot, Mailleux Patrick. J Belg Soc Radiol. 2020 Nov 18;104(1):66. doi: 10.5334/jbsr.2161. Figure 1.
Ipilimumab (Immune Checkpoint Inhibitors) Hypophysitis

Original figure & article ↗ · CC BY 4.0 ↗

None. Original figure, unmodified; all published panels and annotations retained.

Used in: Checkpoint-associated hypophysitis

File provenance

Source: PubMed Central / U.S. National Library of Medicine. Retrieved 2026-10-28 Retrieved from the official PMC Open Access dataset. This stored copy may not include later source updates. No NLM endorsement.

SHA-256: fff98261ab5266b7010cbdeb9faa3f428a72407fc32f288b908cd330a22924a3

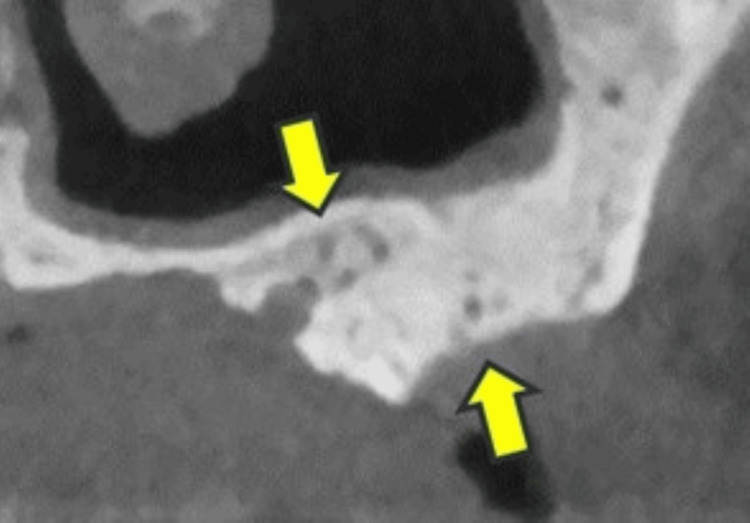
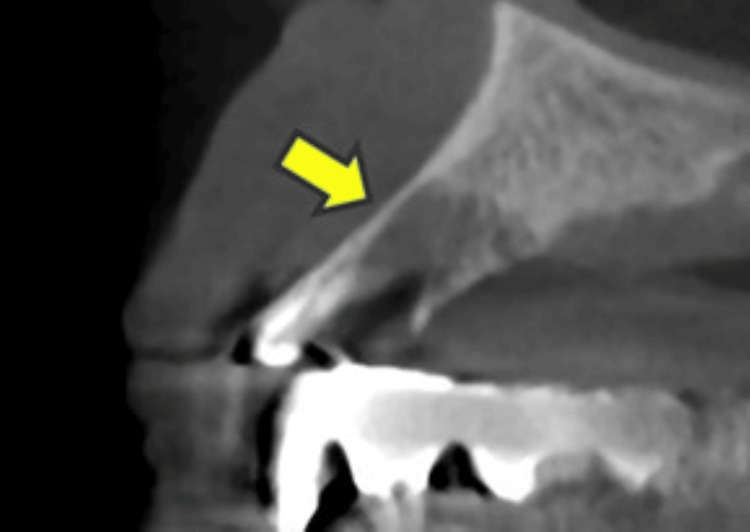
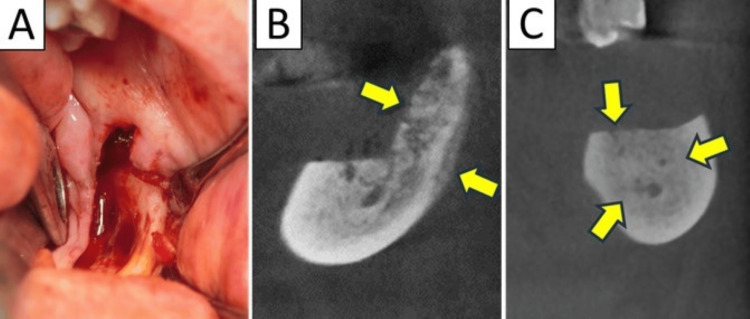
Jaw CT/CBCT findings in source case 2.
treatment example · Figure 2

Jaw CT/CBCT findings in source case 2.

Original context: Bisphosphonate plus denosumab in multiple myeloma; 78-year-old woman.

Repeat operations/follow-up in one figure remain one case. Source calls the prior bisphosphonate BP; it does not name zoledronic acid. Clinical criteria establish MRONJ.

Sawada Shunsuke, Sakamoto Yuki, Kirihigashi Mako et al.. Cureus. 2024 Jun 22;16(6):e62930. doi: 10.7759/cureus.62930. Figure 2.
Postoperative Recurrence of Medication-Related Osteonecrosis of the Jaw: A Retrospective Study of 150 Patients Undergoing Surgery

Original figure & article ↗ · CC BY 4.0 ↗

None. Original figure, unmodified; all published panels and annotations retained.

Used in: Medication-related osteonecrosis of the jaw

File provenance

Source: PubMed Central / U.S. National Library of Medicine. Retrieved 2026-10-28 Retrieved from the official PMC Open Access dataset. This stored copy may not include later source updates. No NLM endorsement.

SHA-256: 33dfdb3568dfa1da9b5e243f3928ae6638ea5db5509df24dc4cc7e09627cfa30

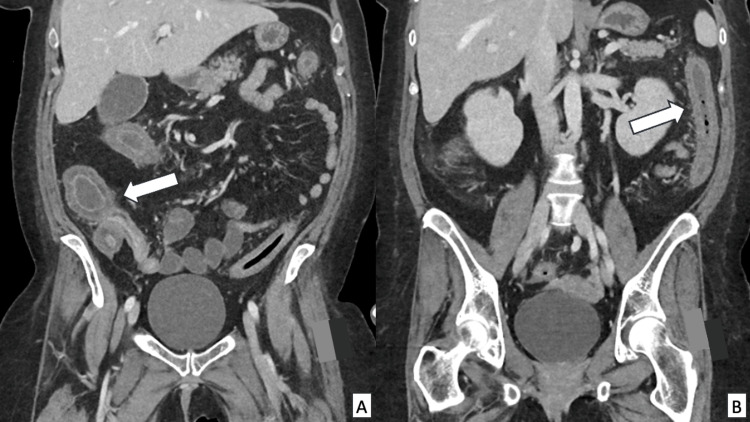
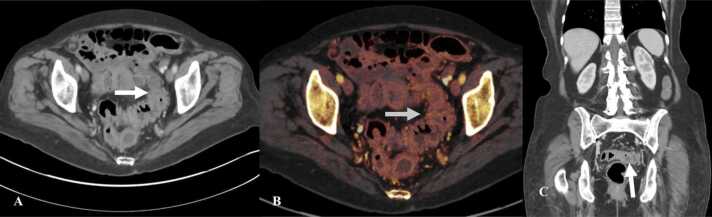
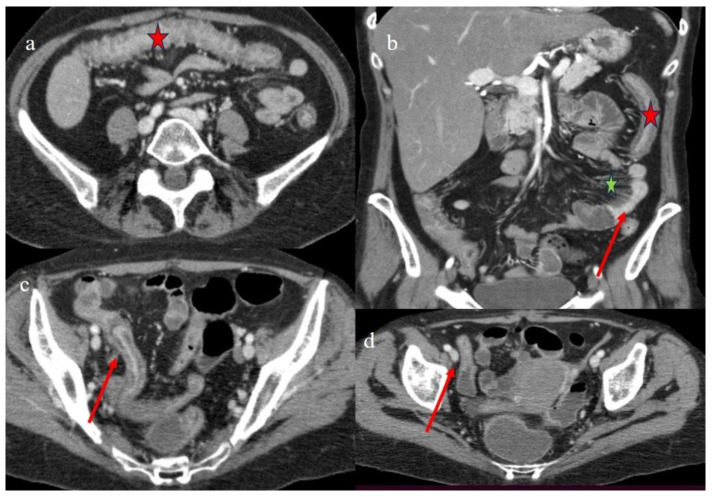
CT pancolonic and terminal-ileal mural thickening.
treatment example · Figure 2

CT pancolonic and terminal-ileal mural thickening.

Original context: Allogeneic HSCT for angioimmunoblastic T-cell lymphoma.

Ziegler Olivia, Jikaria Neekita R, Cioccio Joseph et al.. Cureus. 2024 Apr 8;16(4):e57829. doi: 10.7759/cureus.57829. Figure 2.
A Case Report of Refractory Graft-Versus-Host Disease Colitis Managed With Robotic Total Abdominal Colectomy

Original figure & article ↗ · CC BY 4.0 ↗

None. Original figure, unmodified; all published panels and annotations retained.

Used in: Acute gastrointestinal graft-versus-host disease

File provenance

Source: PubMed Central / U.S. National Library of Medicine. Retrieved 2026-10-28 Retrieved from the official PMC Open Access dataset. This stored copy may not include later source updates. No NLM endorsement.

SHA-256: 2267392602aa6e5a0353bd417601c3865830e1571fb029ba6fd35419e0255bcf

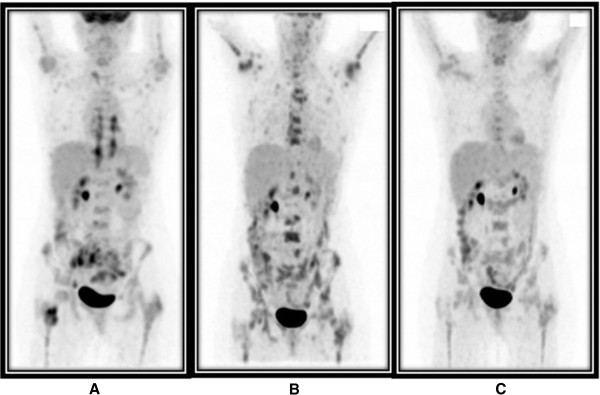
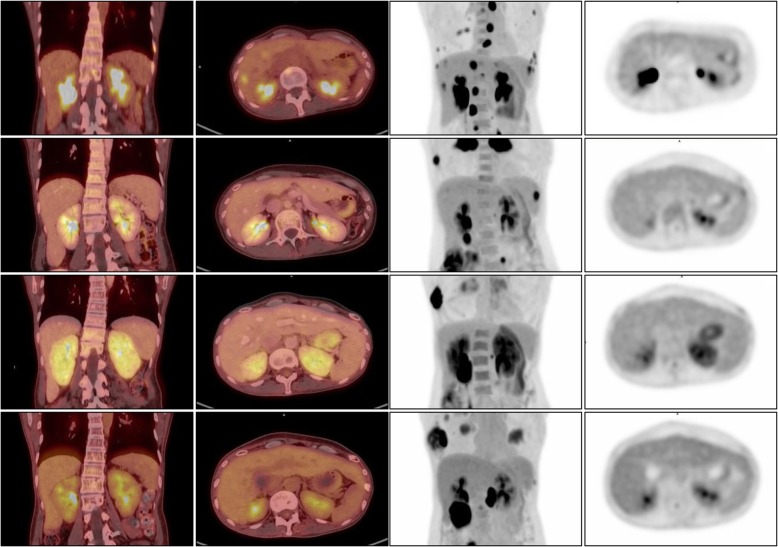
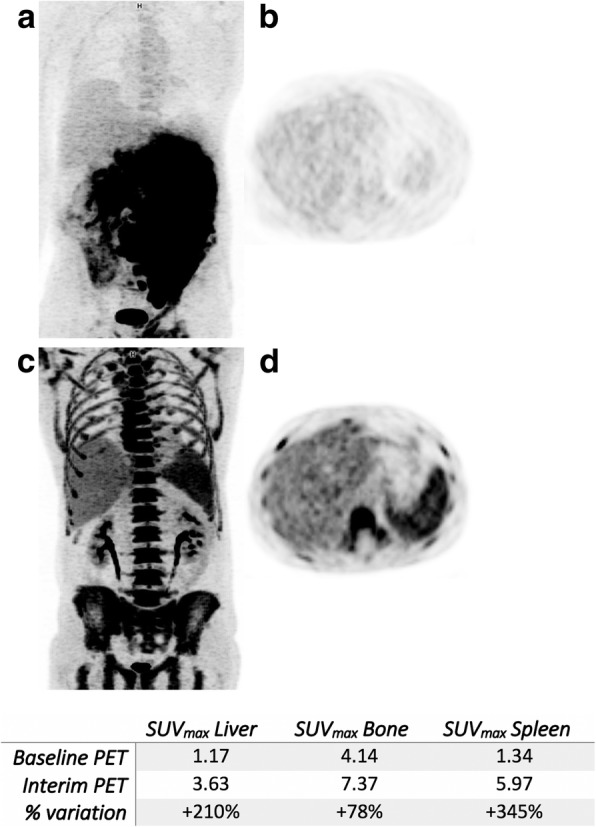
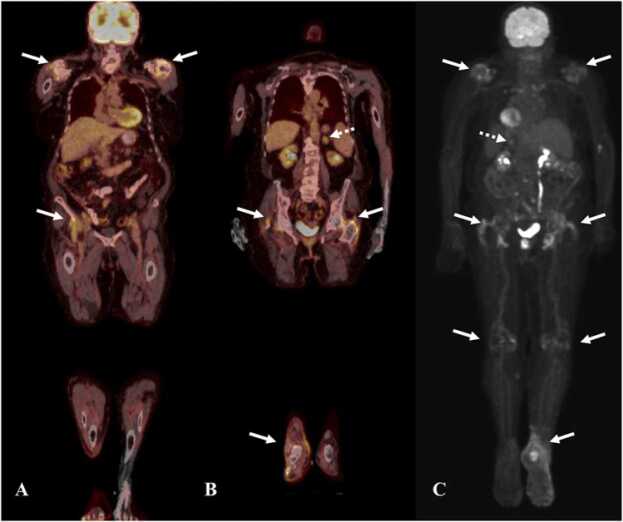
Serial PET shows heterogeneous marrow activation after lymphoma therapy.
treatment example · Figure 1

Serial PET shows heterogeneous marrow activation after lymphoma therapy.

Original context: CHOP-R with pegfilgrastim; baseline marrow involvement.

Baseline disease and marrow regeneration are both relevant; all three panels are one patient.

Cherk Martin H, Patil Sushrut, Beech Paul et al.. J Med Case Rep. 2014 Nov 7;8:362. doi: 10.1186/1752-1947-8-362. Figure 1.
Heterogeneous bone marrow uptake on interim 18F-fluorodeoxyglucose positron emission tomography for lymphoma mimicking disease progression: a case report

Original figure & article ↗ · CC BY 4.0 ↗

None. Original figure, unmodified; all published panels and annotations retained.

Used in: Diffuse marrow & splenic FDG uptake · Marrow FDG activation after filgrastim

File provenance

Source: PubMed Central / U.S. National Library of Medicine. Retrieved 2026-10-28 Retrieved from the official PMC Open Access dataset. This stored copy may not include later source updates. No NLM endorsement.

SHA-256: cc76a698f709ab0bfb53e4290e24924546204effa41689ae110d9cd2eb7660a3

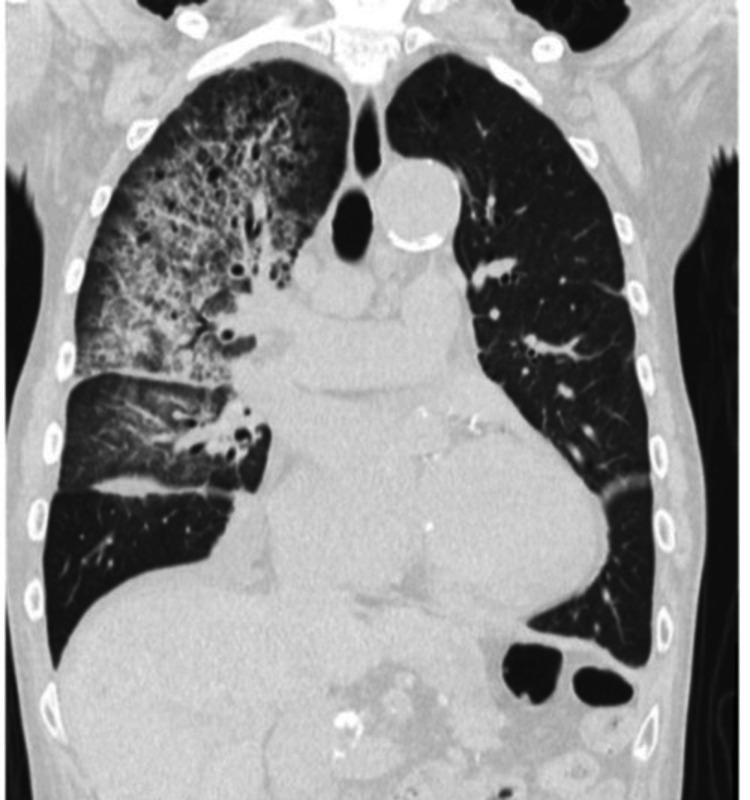
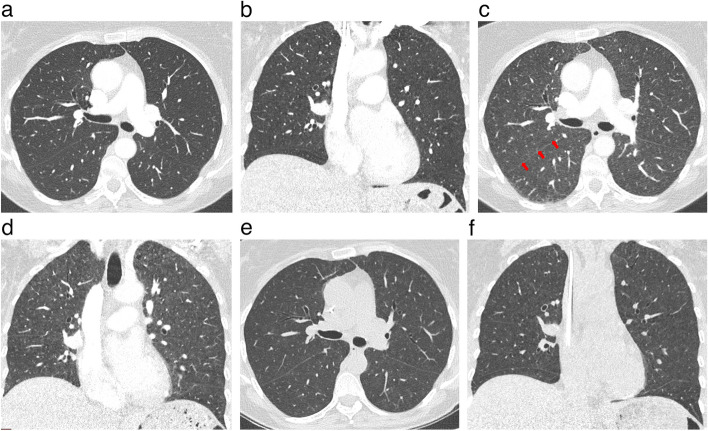
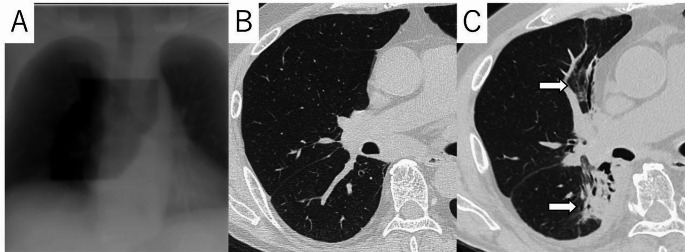
Pattern example from post-infectious bronchiolitis obliterans: CT air trapping and mosaic attenuation. This patient did not undergo HSCT; the image illustrates the small-airway pattern only.
pattern example · Figure 3

Pattern example from post-infectious bronchiolitis obliterans: CT air trapping and mosaic attenuation. This patient did not undergo HSCT; the image illustrates the small-airway pattern only.

Original context: POST-INFECTIOUS bronchiolitis obliterans after influenza B and PVL-producing Staphylococcus aureus pneumonia. No HSCT and no cancer-drug exposure. Pattern illustration only; must never be described as post-transplant BOS evidence.

Source context must be retained. Postoperative/atypical or different-cause example; see original figure.

Nadeem Sabha, Sargent Georgina, Wood Gordon et al.. Cureus. 2025 Sep 4;17(9):e91611. doi: 10.7759/cureus.91611. Figure 3.
Bronchiolitis Obliterans in an Adult Male After Admission With Panton-Valentine Leucocidin Staphylococcal Pneumonia

Original figure & article ↗ · CC BY 4.0 ↗

None. Original figure, unmodified; all published panels and annotations retained.

Used in: Bronchiolitis obliterans syndrome after allogeneic HCT

File provenance

Source: PubMed Central / U.S. National Library of Medicine. Retrieved 2026-10-28 Retrieved from the official PMC Open Access dataset. This stored copy may not include later source updates. No NLM endorsement.

SHA-256: 4a1934e5f031103973822805ffbbe1b3cbf730c9bea3f3beeef93dfa8465f06c

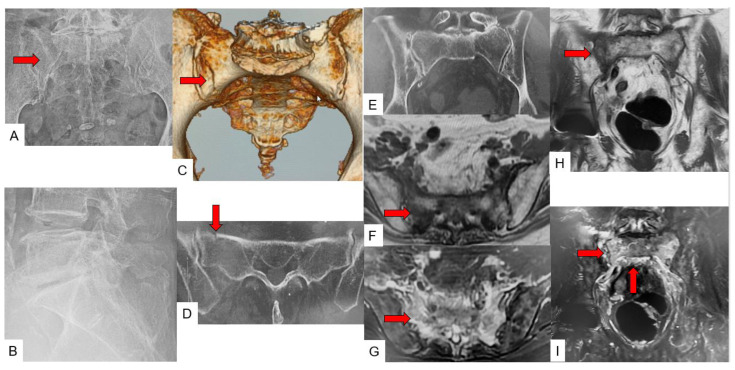
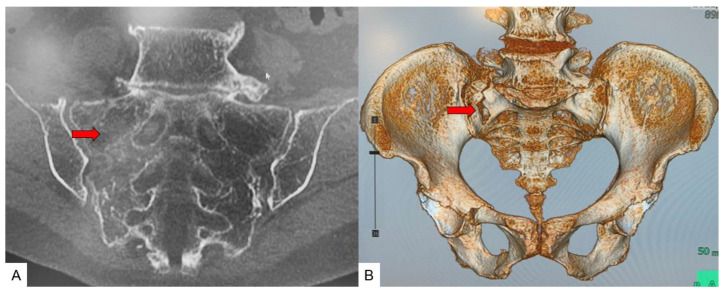
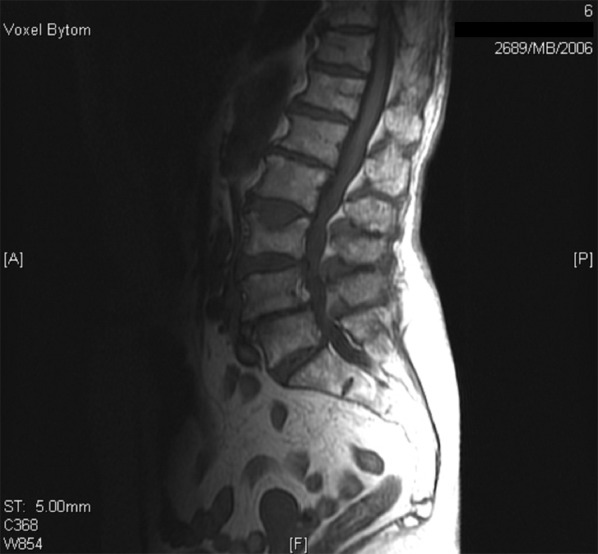
Sacral insufficiency fracture on the original radiograph, CT and/or MRI panels.
pattern example · Figure 7

Sacral insufficiency fracture on the original radiograph, CT and/or MRI panels.

Original context: 87-year-old woman with sacral insufficiency fracture; oncology endocrine treatment is not stated.

Generic fragility-fracture appearance. This case does not establish aromatase-inhibitor, apalutamide or enzalutamide causality; CT/MRI does not diagnose osteoporosis by itself.

Yamauchi Taro, Sharma Sagar, Chandra Sarath et al.. J Clin Med. 2022 Aug 24;11(17):4968. doi: 10.3390/jcm11174968. Figure 7.
Superiority of MRI for Evaluation of Sacral Insufficiency Fracture

Original figure & article ↗ · CC BY 4.0 ↗

None. Original figure, unmodified; all published panels and annotations retained.

Used in: Bone loss during aromatase inhibition: assess fractures separately · Fractures during apalutamide-containing treatment · Fractures during enzalutamide-containing treatment

File provenance

Source: PubMed Central / U.S. National Library of Medicine. Retrieved 2026-10-28 Retrieved from the official PMC Open Access dataset. This stored copy may not include later source updates. No NLM endorsement.

SHA-256: 7f7ec3df115f19275301475a98fb368808cec786df5932d62d52182f563c19a5

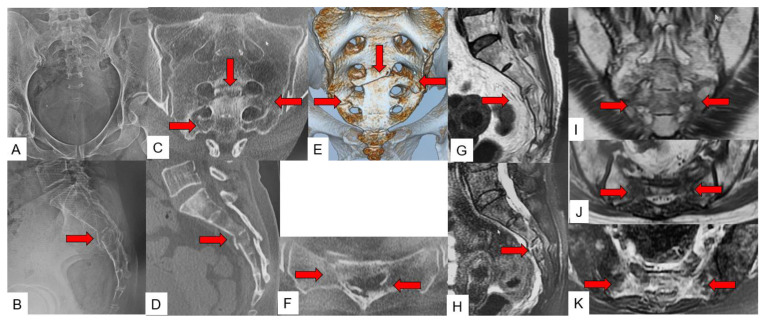
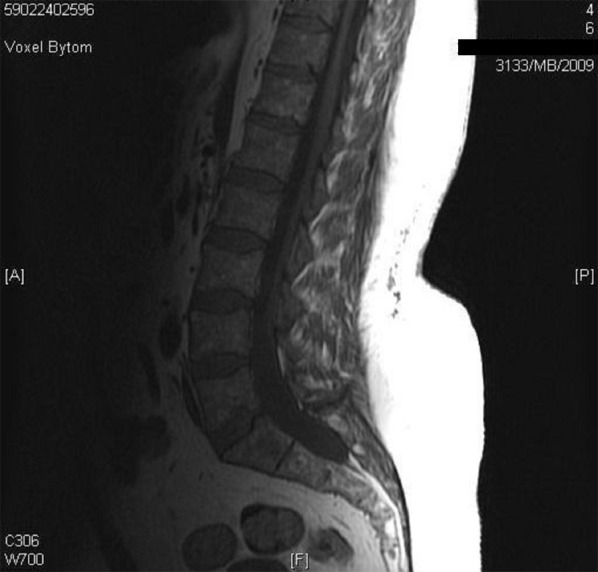
Sacral insufficiency fracture on the original radiograph, CT and/or MRI panels.
pattern example · Figure 8

Sacral insufficiency fracture on the original radiograph, CT and/or MRI panels.

Original context: 57-year-old woman with sacral insufficiency fracture; oncology endocrine treatment is not stated.

Generic fragility-fracture appearance. This case does not establish aromatase-inhibitor, apalutamide or enzalutamide causality; CT/MRI does not diagnose osteoporosis by itself.

Yamauchi Taro, Sharma Sagar, Chandra Sarath et al.. J Clin Med. 2022 Aug 24;11(17):4968. doi: 10.3390/jcm11174968. Figure 8.
Superiority of MRI for Evaluation of Sacral Insufficiency Fracture

Original figure & article ↗ · CC BY 4.0 ↗

None. Original figure, unmodified; all published panels and annotations retained.

Used in: Bone loss during aromatase inhibition: assess fractures separately · Fractures during apalutamide-containing treatment · Fractures during enzalutamide-containing treatment

File provenance

Source: PubMed Central / U.S. National Library of Medicine. Retrieved 2026-10-28 Retrieved from the official PMC Open Access dataset. This stored copy may not include later source updates. No NLM endorsement.

SHA-256: eec1af967ab14501b11cbbd23bb869740a3885426b16d8095caec905c9d32590

Sacral insufficiency fracture on the original radiograph, CT and/or MRI panels.
pattern example · Figure 9

Sacral insufficiency fracture on the original radiograph, CT and/or MRI panels.

Original context: 89-year-old woman with sacral insufficiency fracture; oncology endocrine treatment is not stated.

Generic fragility-fracture appearance. This case does not establish aromatase-inhibitor, apalutamide or enzalutamide causality; CT/MRI does not diagnose osteoporosis by itself.

Yamauchi Taro, Sharma Sagar, Chandra Sarath et al.. J Clin Med. 2022 Aug 24;11(17):4968. doi: 10.3390/jcm11174968. Figure 9.
Superiority of MRI for Evaluation of Sacral Insufficiency Fracture

Original figure & article ↗ · CC BY 4.0 ↗

None. Original figure, unmodified; all published panels and annotations retained.

Used in: Bone loss during aromatase inhibition: assess fractures separately · Fractures during apalutamide-containing treatment · Fractures during enzalutamide-containing treatment

File provenance

Source: PubMed Central / U.S. National Library of Medicine. Retrieved 2026-10-28 Retrieved from the official PMC Open Access dataset. This stored copy may not include later source updates. No NLM endorsement.

SHA-256: 3a40bfdfe37cb9bd7be5faa7a912f34283e8f3452b490ed4b7563965000b22a9

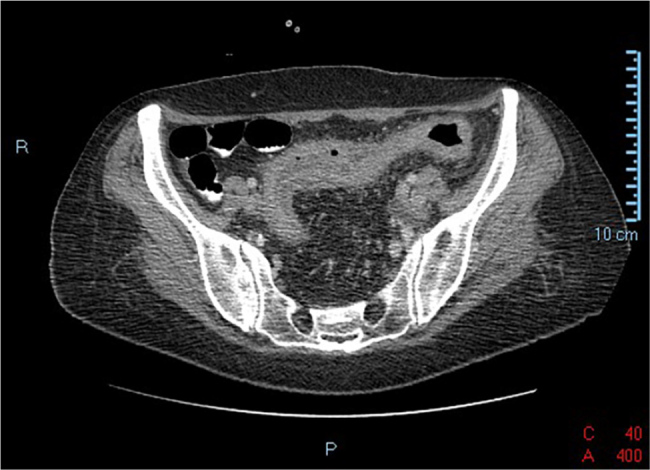
Colonic mural inflammation on CT.
treatment example · Fig. 8

Colonic mural inflammation on CT.

Original context: Nivolumab in a 73-year-old woman with renal-cell carcinoma.

Gosangi Babina, McIntosh Lacey, Keraliya Abhishek et al.. Eur J Radiol Open. 2022 Aug 8;9:100434. doi: 10.1016/j.ejro.2022.100434. Fig. 8.
Imaging features of toxicities associated with immune checkpoint inhibitors

Original figure & article ↗ · CC BY 4.0 ↗

None. Original figure, unmodified; all published panels and annotations retained.

Used in: Immune-mediated colitis · Docetaxel-associated enterocolitis · Idelalisib-associated colitis

File provenance

Source: PubMed Central / U.S. National Library of Medicine. Retrieved 2026-10-28 Retrieved from the official PMC Open Access dataset. This stored copy may not include later source updates. No NLM endorsement.

SHA-256: cabc85920fd69e6c9b74c2f083963435a90fad3981cd4d3e294a5f348b7f816c

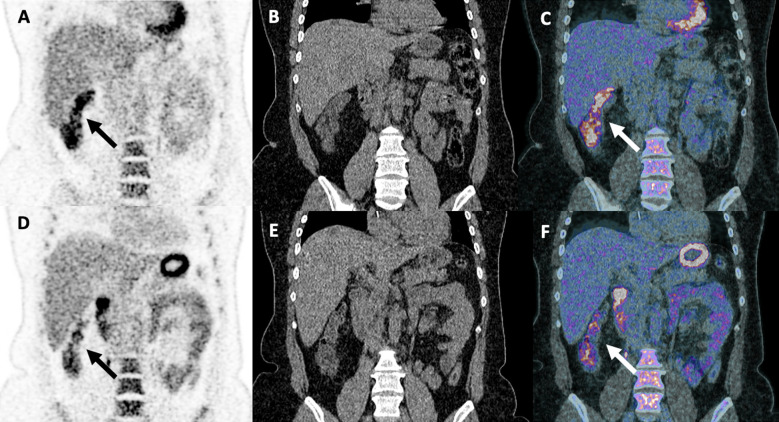
Right-colon FDG uptake with interval change.
treatment example · Figure 1

Right-colon FDG uptake with interval change.

Original context: Ipilimumab plus nivolumab in a 48-year-old woman with melanoma.

Berz Antonia M., Boughdad Sarah, Vietti-Violi Naïk et al.. Front Immunol. 2023 Feb 23;14:1133207. doi: 10.3389/fimmu.2023.1133207. Figure 1.
Imaging assessment of toxicity related to immune checkpoint inhibitors

Original figure & article ↗ · CC BY 4.0 ↗

None. Original figure, unmodified; all published panels and annotations retained.

Used in: Immune-mediated colitis · Docetaxel-associated enterocolitis · Idelalisib-associated colitis

File provenance

Source: PubMed Central / U.S. National Library of Medicine. Retrieved 2026-10-28 Retrieved from the official PMC Open Access dataset. This stored copy may not include later source updates. No NLM endorsement.

SHA-256: df2c6f3588e006a20330222edbbcbd11523abc59a15e95546a9fbb7d0abbc947

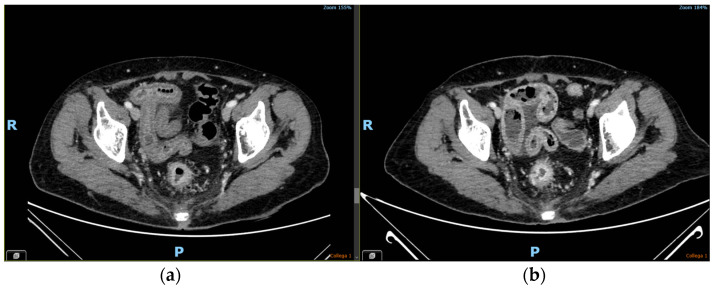
CT bowel inflammation in source case 1.
treatment example · Figure 1

CT bowel inflammation in source case 1.

Original context: Allogeneic HSCT; source case 1.

Some original figures also contain endoscopy or histology panels. CT panels provide the clinical imaging example; a follow-up is not a new patient.

Brogna Barbara, Frieri Camilla, Risitiano Antonio Maria et al.. Biomedicines. 2024 Jul 8;12(7):1516. doi: 10.3390/biomedicines12071516. Figure 1.
Intestinal and Extraintestinal Findings of Graft-versus-Host Disease on CT: A Case Series with Radiological and Histopathological Correlations

Original figure & article ↗ · CC BY 4.0 ↗

None. Original figure, unmodified; all published panels and annotations retained.

Used in: Acute gastrointestinal graft-versus-host disease

File provenance

Source: PubMed Central / U.S. National Library of Medicine. Retrieved 2026-10-28 Retrieved from the official PMC Open Access dataset. This stored copy may not include later source updates. No NLM endorsement.

SHA-256: cf4c1f1a2fe573ab01c3de1665437355aec89e67a91cd950ef908441380ded12

CT bowel inflammation in source case 2.
treatment example · Figure 2

CT bowel inflammation in source case 2.

Original context: Allogeneic HSCT; source case 2.

Some original figures also contain endoscopy or histology panels. CT panels provide the clinical imaging example; a follow-up is not a new patient.

Brogna Barbara, Frieri Camilla, Risitiano Antonio Maria et al.. Biomedicines. 2024 Jul 8;12(7):1516. doi: 10.3390/biomedicines12071516. Figure 2.
Intestinal and Extraintestinal Findings of Graft-versus-Host Disease on CT: A Case Series with Radiological and Histopathological Correlations

Original figure & article ↗ · CC BY 4.0 ↗

None. Original figure, unmodified; all published panels and annotations retained.

Used in: Acute gastrointestinal graft-versus-host disease

File provenance

Source: PubMed Central / U.S. National Library of Medicine. Retrieved 2026-10-28 Retrieved from the official PMC Open Access dataset. This stored copy may not include later source updates. No NLM endorsement.

SHA-256: ac5d7b512046678ecf72b53c42d5382d7b529a08194590a49f7dd06c2a383d1b

CT bowel inflammation in source case 3.
treatment example · Figure 3

CT bowel inflammation in source case 3.

Original context: Allogeneic HSCT; source case 3.

Some original figures also contain endoscopy or histology panels. CT panels provide the clinical imaging example; a follow-up is not a new patient.

Brogna Barbara, Frieri Camilla, Risitiano Antonio Maria et al.. Biomedicines. 2024 Jul 8;12(7):1516. doi: 10.3390/biomedicines12071516. Figure 3.
Intestinal and Extraintestinal Findings of Graft-versus-Host Disease on CT: A Case Series with Radiological and Histopathological Correlations

Original figure & article ↗ · CC BY 4.0 ↗

None. Original figure, unmodified; all published panels and annotations retained.

Used in: Acute gastrointestinal graft-versus-host disease

File provenance

Source: PubMed Central / U.S. National Library of Medicine. Retrieved 2026-10-28 Retrieved from the official PMC Open Access dataset. This stored copy may not include later source updates. No NLM endorsement.

SHA-256: 19cf6bb4039a30914b75213286b82e3f2baeb2a5b0f89633fa183600db809f73

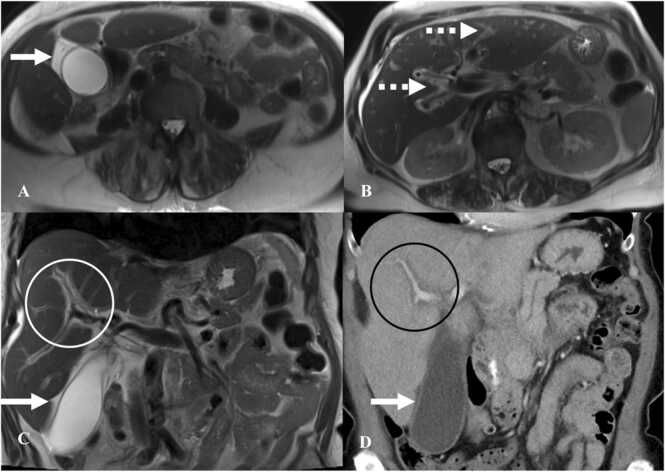
Periportal and gallbladder-wall edema on CT/MRI.
treatment example · Fig. 9

Periportal and gallbladder-wall edema on CT/MRI.

Original context: Pembrolizumab in a 68-year-old man with melanoma.

Gosangi Babina, McIntosh Lacey, Keraliya Abhishek et al.. Eur J Radiol Open. 2022 Aug 8;9:100434. doi: 10.1016/j.ejro.2022.100434. Fig. 9.
Imaging features of toxicities associated with immune checkpoint inhibitors

Original figure & article ↗ · CC BY 4.0 ↗

None. Original figure, unmodified; all published panels and annotations retained.

Used in: Immune-mediated hepatitis

File provenance

Source: PubMed Central / U.S. National Library of Medicine. Retrieved 2026-10-28 Retrieved from the official PMC Open Access dataset. This stored copy may not include later source updates. No NLM endorsement.

SHA-256: c36d34db483c6c76a2153dcba78ac01c880e8eb4520f4c456f8078668b020a82

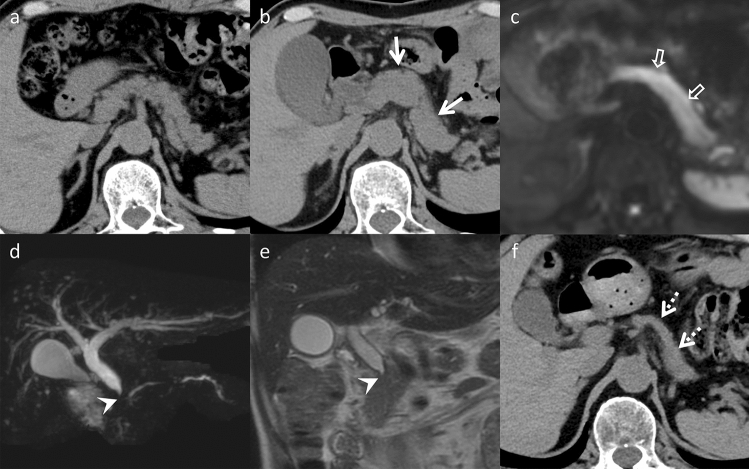
MRI/MRCP findings in concurrent hepatobiliary and pancreatic inflammation.
treatment example · Fig. 2

MRI/MRCP findings in concurrent hepatobiliary and pancreatic inflammation.

Original context: Immune-checkpoint therapy; same patient throughout Figures 1–3.

One multisystem patient, not one patient per organ. Clinical and pathological correlation was required.

Kawata Kana, Inoue Dai, Komori Takahiro et al.. Abdom Radiol (NY). 2025 May 27;50(12):5845–51. doi: 10.1007/s00261-025-04994-w. Fig. 2.
Case of simultaneous occurrence of hepatitis, cholangitis, and pancreatitis as immune-related adverse events induced by immune checkpoint inhibitor therapy: a case report

Original figure & article ↗ · CC BY 4.0 ↗

None. Original figure, unmodified; all published panels and annotations retained.

Used in: Immune-mediated hepatitis · ICI-associated cholangitis · ICI-associated pancreatic inflammation

File provenance

Source: PubMed Central / U.S. National Library of Medicine. Retrieved 2026-10-28 Retrieved from the official PMC Open Access dataset. This stored copy may not include later source updates. No NLM endorsement.

SHA-256: 3fcfd602b0f8e3e67dcf0fbf916a37d4441dd8d15b94e168dc10a9b60f89ef42

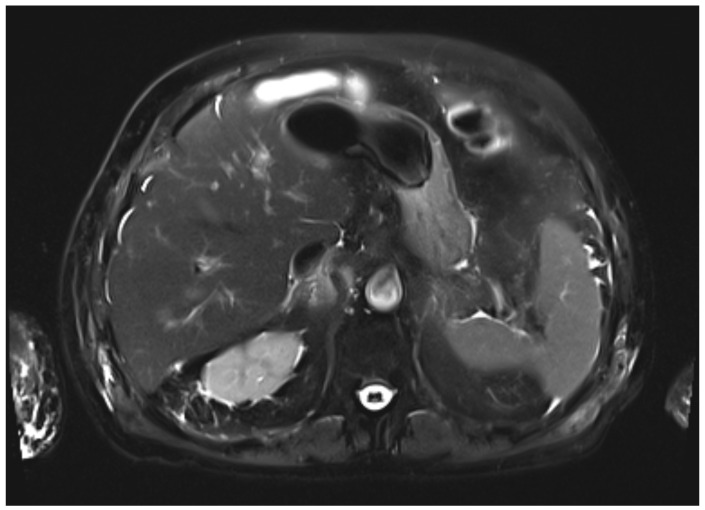
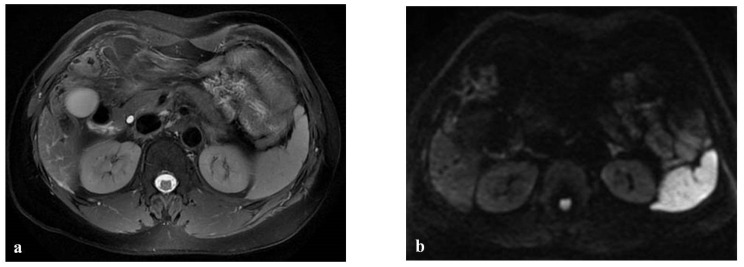
Normal-appearing hepatic signal despite clinically significant immune-mediated hepatitis.
treatment example · Figure 4

Normal-appearing hepatic signal despite clinically significant immune-mediated hepatitis.

Original context: Nivolumab in an elderly patient with metastatic melanoma.

A negative structural MRI example; it does not exclude hepatitis.

Posado-Dominguez Luis, Feito-Perez Jorge, Escribano-Iglesias María et al.. Curr Oncol. 2025 Nov 27;32(12):663. doi: 10.3390/curroncol32120663. Figure 4.
Steroid-Refractory Cholestatic Immune-Mediated Hepatitis Following Nivolumab Therapy in an Elderly Patient with Metastatic Melanoma: A Rare and Challenging Presentation

Original figure & article ↗ · CC BY 4.0 ↗

None. Original figure, unmodified; all published panels and annotations retained.

Used in: Immune-mediated hepatitis

File provenance

Source: PubMed Central / U.S. National Library of Medicine. Retrieved 2026-10-28 Retrieved from the official PMC Open Access dataset. This stored copy may not include later source updates. No NLM endorsement.

SHA-256: ff5e734c5df4e566f010089716f6f0c3d6dd4472d0f47edee30c297092235359

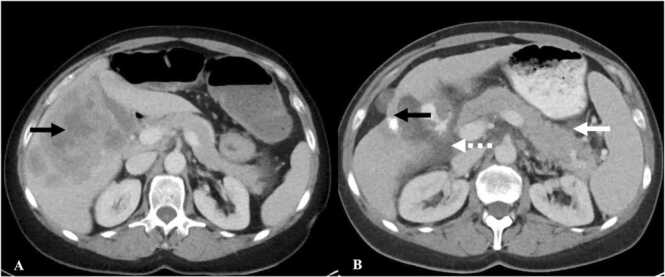
CT pancreatic enlargement and peripancreatic inflammation.
treatment example · Fig. 10

CT pancreatic enlargement and peripancreatic inflammation.

Original context: Pembrolizumab in a 55-year-old man with melanoma.

Gosangi Babina, McIntosh Lacey, Keraliya Abhishek et al.. Eur J Radiol Open. 2022 Aug 8;9:100434. doi: 10.1016/j.ejro.2022.100434. Fig. 10.
Imaging features of toxicities associated with immune checkpoint inhibitors

Original figure & article ↗ · CC BY 4.0 ↗

None. Original figure, unmodified; all published panels and annotations retained.

Used in: ICI-associated pancreatic inflammation · Pegaspargase-associated pancreatitis

File provenance

Source: PubMed Central / U.S. National Library of Medicine. Retrieved 2026-10-28 Retrieved from the official PMC Open Access dataset. This stored copy may not include later source updates. No NLM endorsement.

SHA-256: 76aa5b00b9a07df76aa105b4482731c59d9e9b929976aa7e040163fd81265d87

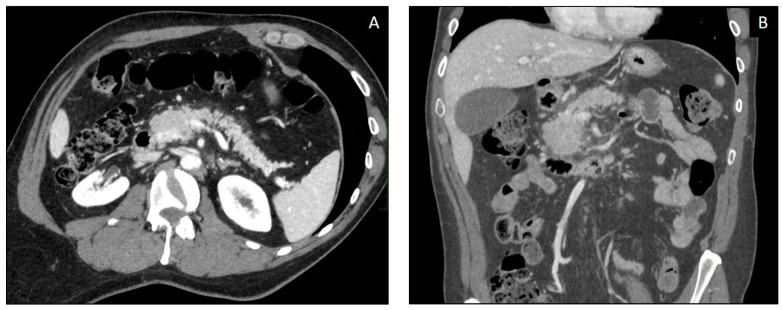
Acute pancreatic inflammatory changes on CT.
treatment example · Figure 2

Acute pancreatic inflammatory changes on CT.

Original context: Ipilimumab in a 50-year-old patient with melanoma.

Mallio Carlo Augusto, Bernetti Caterina, Cea Laura et al.. Curr Oncol. 2023 May 3;30(5):4700–23. doi: 10.3390/curroncol30050355. Figure 2.
Adverse Effects of Immune-Checkpoint Inhibitors: A Comprehensive Imaging-Oriented Review

Original figure & article ↗ · CC BY 4.0 ↗

None. Original figure, unmodified; all published panels and annotations retained.

Used in: ICI-associated pancreatic inflammation · Pegaspargase-associated pancreatitis

File provenance

Source: PubMed Central / U.S. National Library of Medicine. Retrieved 2026-10-28 Retrieved from the official PMC Open Access dataset. This stored copy may not include later source updates. No NLM endorsement.

SHA-256: 39091587b44527247e0d2b943b4f630124d35aa80c78c8188940a17260808dbf

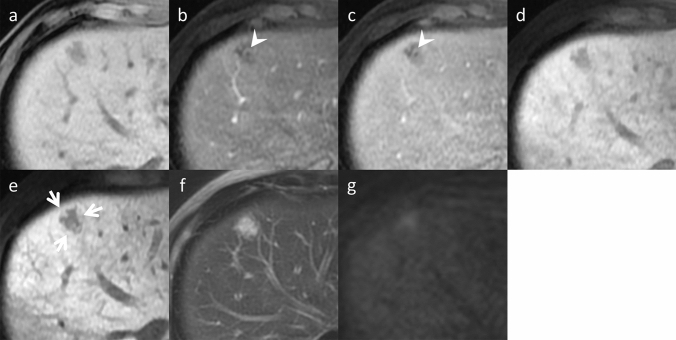
Focal SOS mimicking a hepatic metastasis on MRI.
treatment example · Fig. 4

Focal SOS mimicking a hepatic metastasis on MRI.

Original context: Oxaliplatin-containing chemotherapy in a 49-year-old man.

Source exposure remains explicit. In PMC10899361, Figures 2 and 3 are the same patient.

Ichikawa Shintaro, Goshima Satoshi. Jpn J Radiol. 2023 Nov 6;42(3):235–45. doi: 10.1007/s11604-023-01505-z. Fig. 4.
Key CT and MRI findings of drug-associated hepatobiliary and pancreatic disorders

Original figure & article ↗ · CC BY 4.0 ↗

None. Original figure, unmodified; all published panels and annotations retained.

Used in: Oxaliplatin-associated sinusoidal liver injury · Hepatic sinusoidal obstruction after transplantation · Hepatic SOS / VOD after inotuzumab · SOS / VOD after gemtuzumab ozogamicin

File provenance

Source: PubMed Central / U.S. National Library of Medicine. Retrieved 2026-10-28 Retrieved from the official PMC Open Access dataset. This stored copy may not include later source updates. No NLM endorsement.

SHA-256: 2bc51a5859ca5b60777c9a79e80a47e06b9281e47dfd2e6d427f845794bf43cd

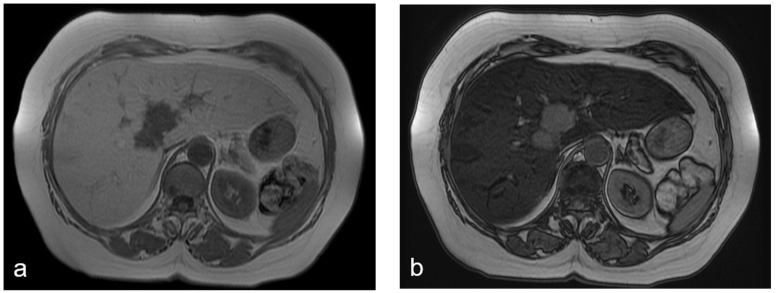
Diffuse reticular hepatic abnormality with a focal pseudotumor.
treatment example · Figure 4

Diffuse reticular hepatic abnormality with a focal pseudotumor.

Original context: FOLFOX in a 62-year-old woman with rectal-cancer liver metastases.

Source exposure remains explicit. In PMC10899361, Figures 2 and 3 are the same patient.

Donati Francescamaria, Cioni Dania, Guarino Salvatore et al.. Diagnostics (Basel). 2022 Mar 31;12(4):867. doi: 10.3390/diagnostics12040867. Figure 4.
Chemotherapy-Induced Liver Injury in Patients with Colorectal Liver Metastases: Findings from MR Imaging

Original figure & article ↗ · CC BY 4.0 ↗

None. Original figure, unmodified; all published panels and annotations retained.

Used in: Oxaliplatin-associated sinusoidal liver injury · Hepatic sinusoidal obstruction after transplantation · Hepatic SOS / VOD after inotuzumab · SOS / VOD after gemtuzumab ozogamicin

File provenance

Source: PubMed Central / U.S. National Library of Medicine. Retrieved 2026-10-28 Retrieved from the official PMC Open Access dataset. This stored copy may not include later source updates. No NLM endorsement.

SHA-256: eada05e1ecb9584b0f11defc9dd1a918e79654f1dbd906afbb7ab02f85f1163a

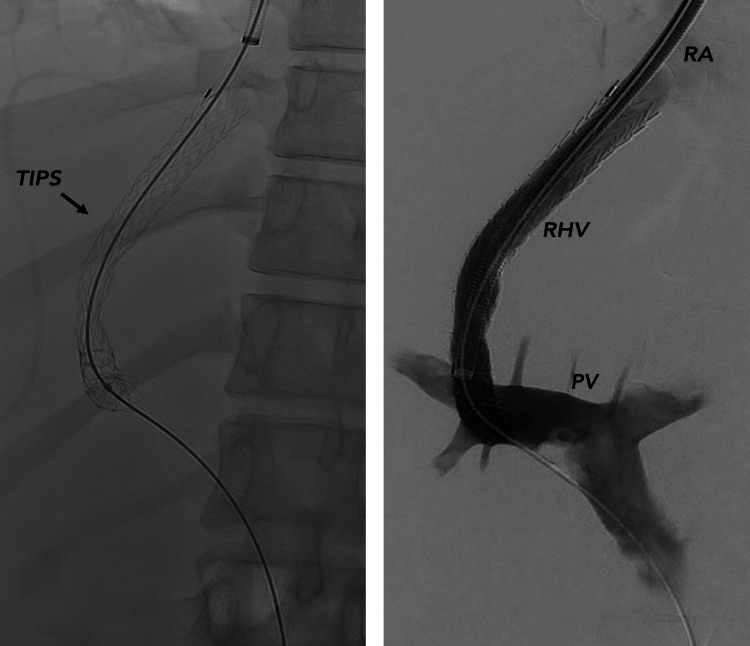
Portal venographic imaging during TIPS for severe SOS.
treatment example · Figure 2

Portal venographic imaging during TIPS for severe SOS.

Original context: Gemtuzumab ozogamicin-containing AML treatment.

Procedural angiography, not a diagnostic CT/MRI signature of SOS. The pressure measurements and treatment response do not establish imaging sensitivity.

Thielemans Naomi, De Beule Nathan, Van den Bergh Frans et al.. Cureus. 2024 Aug 24;16(8):e67682. doi: 10.7759/cureus.67682. Figure 2.
Successful Treatment of Very Severe Sinusoidal Obstruction Syndrome After Gemtuzumab Ozogamicin With Transjugular Intrahepatic Portosystemic Shunt, Defibrotide, and High-Dose Corticosteroids: A Case Report

Original figure & article ↗ · CC BY 4.0 ↗

None. Original figure, unmodified; all published panels and annotations retained.

Used in: SOS / VOD after gemtuzumab ozogamicin

File provenance

Source: PubMed Central / U.S. National Library of Medicine. Retrieved 2026-10-28 Retrieved from the official PMC Open Access dataset. This stored copy may not include later source updates. No NLM endorsement.

SHA-256: 9251dd6996f66633ff9e8d918ad97499e54307c3cc546f689c8d63cc1b24f388

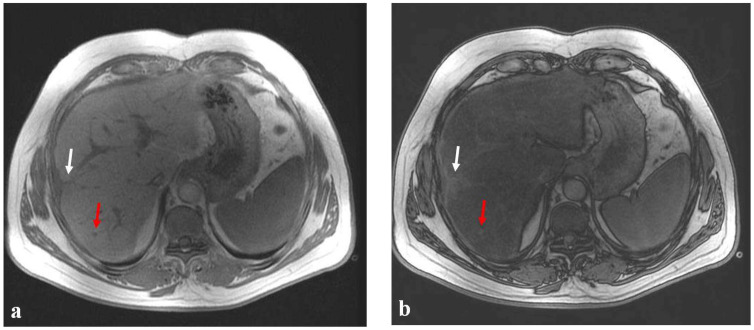
Chemical-shift MRI demonstrates hepatic fat during FOLFIRI.
treatment example · Figure 1

Chemical-shift MRI demonstrates hepatic fat during FOLFIRI.

Original context: FOLFIRI; 68-year-old woman.

Imaging depicts steatosis; it does not establish histologic steatohepatitis.

Donati Francescamaria, Cioni Dania, Guarino Salvatore et al.. Diagnostics (Basel). 2022 Mar 31;12(4):867. doi: 10.3390/diagnostics12040867. Figure 1.
Chemotherapy-Induced Liver Injury in Patients with Colorectal Liver Metastases: Findings from MR Imaging

Original figure & article ↗ · CC BY 4.0 ↗

None. Original figure, unmodified; all published panels and annotations retained.

Used in: Irinotecan-associated fatty liver / steatohepatitis

File provenance

Source: PubMed Central / U.S. National Library of Medicine. Retrieved 2026-10-28 Retrieved from the official PMC Open Access dataset. This stored copy may not include later source updates. No NLM endorsement.

SHA-256: f85e4774a0f72fe045c6eec4e742c26fb15777821f869c91cb2fa33d92e14a41

Chemical-shift MRI demonstrates hepatic fat during FOLFIRI.
treatment example · Figure 2

Chemical-shift MRI demonstrates hepatic fat during FOLFIRI.

Original context: FOLFIRI; 38-year-old man.

Imaging depicts steatosis; it does not establish histologic steatohepatitis.

Donati Francescamaria, Cioni Dania, Guarino Salvatore et al.. Diagnostics (Basel). 2022 Mar 31;12(4):867. doi: 10.3390/diagnostics12040867. Figure 2.
Chemotherapy-Induced Liver Injury in Patients with Colorectal Liver Metastases: Findings from MR Imaging

Original figure & article ↗ · CC BY 4.0 ↗

None. Original figure, unmodified; all published panels and annotations retained.

Used in: Irinotecan-associated fatty liver / steatohepatitis

File provenance

Source: PubMed Central / U.S. National Library of Medicine. Retrieved 2026-10-28 Retrieved from the official PMC Open Access dataset. This stored copy may not include later source updates. No NLM endorsement.

SHA-256: 4291ba0efb908593c62656e8b2da76d785d003d6f0904377f62ed8884db4e68a

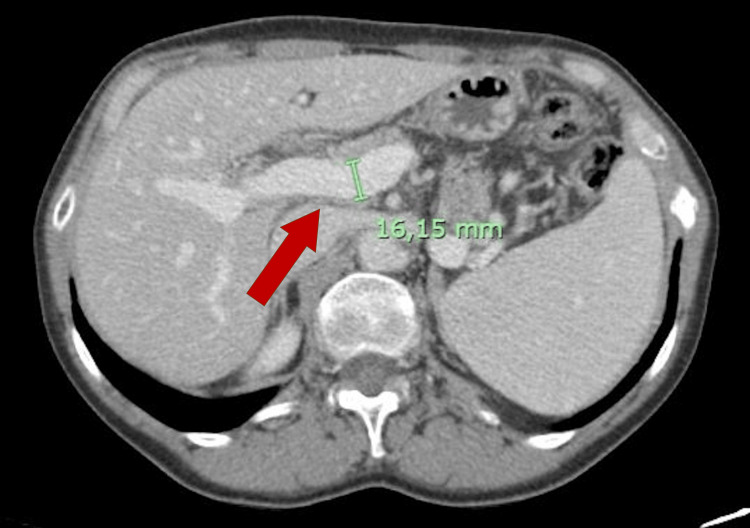
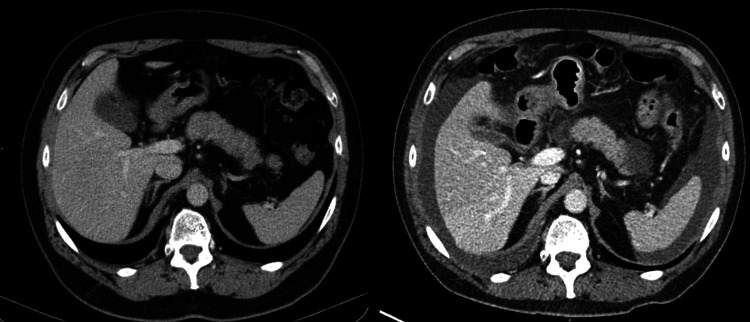
CT portal-vein enlargement during T-DM1.
treatment example · Figure 4

CT portal-vein enlargement during T-DM1.

Original context: Trastuzumab emtansine; same patient in all source figures.

Figures 4 and 5 are complementary images from one patient. Biopsy, not CT alone, defined porto-sinusoidal vascular disorder.

Fernandes Catarina L, Pedro Orlando, Andrade Filipe et al.. Cureus. 2025 Jun 19;17(6):e86333. doi: 10.7759/cureus.86333. Figure 4.
Trastuzumab Emtansine (T-DM1)-Induced Porto-Sinusoidal Vascular Disorder: A Case Report

Original figure & article ↗ · CC BY 4.0 ↗

None. Original figure, unmodified; all published panels and annotations retained.

Used in: Portal hypertension / NRH on T-DM1

File provenance

Source: PubMed Central / U.S. National Library of Medicine. Retrieved 2026-10-28 Retrieved from the official PMC Open Access dataset. This stored copy may not include later source updates. No NLM endorsement.

SHA-256: 96396f80540d5b41f60a42535ccd9737ea0914f99a9cd9c1ee3741dfd3bfb234

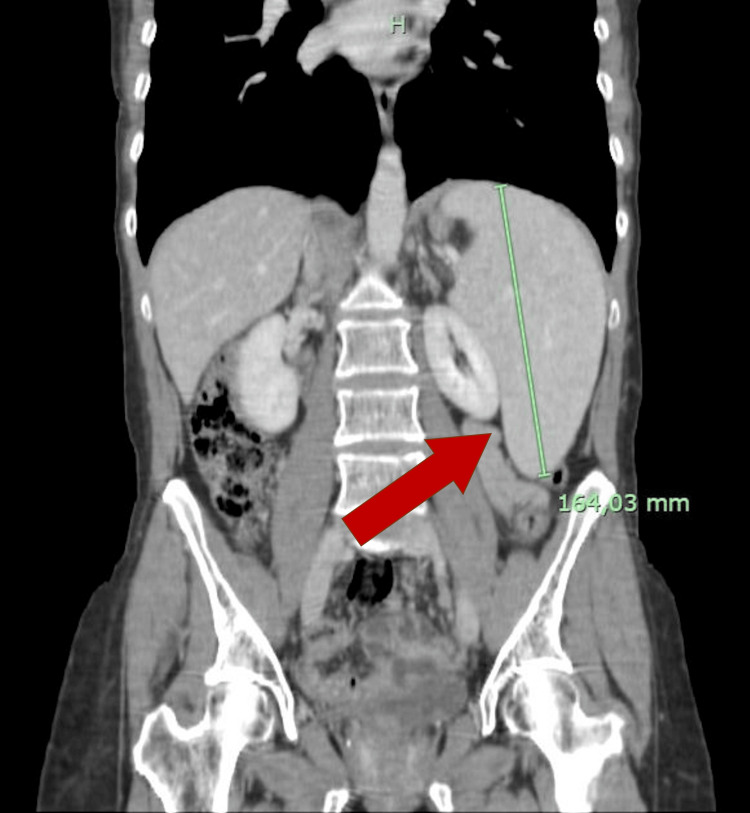
CT new splenomegaly during T-DM1.
treatment example · Figure 5

CT new splenomegaly during T-DM1.

Original context: Trastuzumab emtansine; same patient in all source figures.

Figures 4 and 5 are complementary images from one patient. Biopsy, not CT alone, defined porto-sinusoidal vascular disorder.

Fernandes Catarina L, Pedro Orlando, Andrade Filipe et al.. Cureus. 2025 Jun 19;17(6):e86333. doi: 10.7759/cureus.86333. Figure 5.
Trastuzumab Emtansine (T-DM1)-Induced Porto-Sinusoidal Vascular Disorder: A Case Report

Original figure & article ↗ · CC BY 4.0 ↗

None. Original figure, unmodified; all published panels and annotations retained.

Used in: Portal hypertension / NRH on T-DM1

File provenance

Source: PubMed Central / U.S. National Library of Medicine. Retrieved 2026-10-28 Retrieved from the official PMC Open Access dataset. This stored copy may not include later source updates. No NLM endorsement.

SHA-256: 64f5de501e15ccdb722b79b5c8d5208d23b79a206fbd8656ff8de087822d32e1

Edematous gallbladder wall during acute viral hepatitis.
pattern example · Fig. 5

Edematous gallbladder wall during acute viral hepatitis.

Original context: Hepatitis A in a 59-year-old man; no rituximab exposure.

Generic acute-hepatitis morphology only. This neither depicts HBV reactivation nor establishes rituximab causality.

Malekzadeh Sonaz, Widmer Lucien, Salahshour Faezeh et al.. Abdom Radiol (NY). 2020 Jul 26;46(2):544–61. doi: 10.1007/s00261-020-02642-z. Fig. 5.
Typical imaging finding of hepatic infections: a pictorial essay

Original figure & article ↗ · CC BY 4.0 ↗

None. Original figure, unmodified; all published panels and annotations retained.

Used in: HBV reactivation after rituximab

File provenance

Source: PubMed Central / U.S. National Library of Medicine. Retrieved 2026-10-28 Retrieved from the official PMC Open Access dataset. This stored copy may not include later source updates. No NLM endorsement.

SHA-256: e0fd627ccdcec55faf614fe417ddd55dde6772aa8de68fbbc5867440cb0708d8

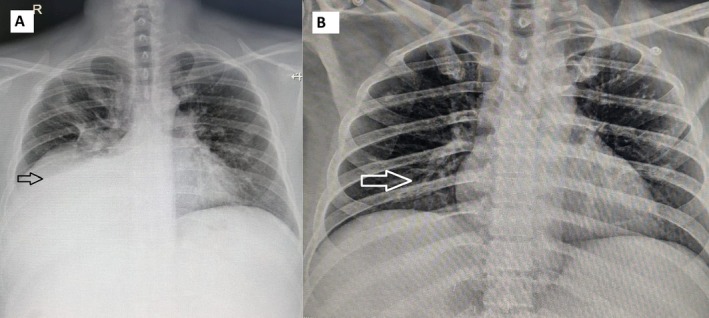
CT at presentation with colostomy perforation/evisceration.
treatment example · Figure 2

CT at presentation with colostomy perforation/evisceration.

Original context: Bevacizumab-containing therapy for rectal cancer with a parastomal hernia.

Case-level combination exposure and local tumor/anatomic contributors remain relevant; the image does not isolate drug causality.

Fazel Darbandi Maziar, Johnson Garrett, Hardy Krista et al.. Cureus. 2025 Nov 28;17(11):e98021. doi: 10.7759/cureus.98021. Figure 2.
Bevacizumab-Associated Bowel Perforation Causing Evisceration

Original figure & article ↗ · CC BY 4.0 ↗

None. Original figure, unmodified; all published panels and annotations retained.

Used in: Bowel perforation / fistula on bevacizumab

File provenance

Source: PubMed Central / U.S. National Library of Medicine. Retrieved 2026-10-28 Retrieved from the official PMC Open Access dataset. This stored copy may not include later source updates. No NLM endorsement.

SHA-256: 35a69dfc0ecd4a5561ed12754be6cf97d2d5f80d234b342f50bb887351796fae

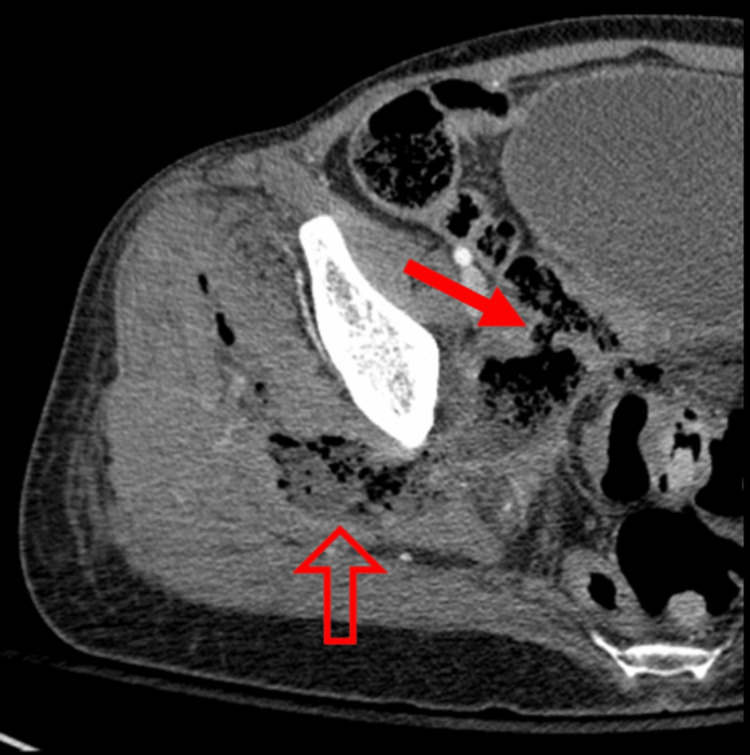
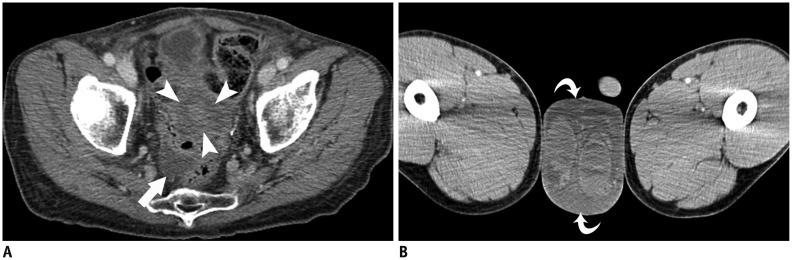
CT demonstrates an enteric fistula tract into a pelvic collection.
treatment example · Figure 4

CT demonstrates an enteric fistula tract into a pelvic collection.

Original context: Bevacizumab-containing therapy in recurrent pelvic malignancy.

Case-level combination exposure and local tumor/anatomic contributors remain relevant; the image does not isolate drug causality.

Wallace Madison L, Akbarshahi Linda, Bond Matthew et al.. Cureus. 2025 Sep 22;17(9):e92925. doi: 10.7759/cureus.92925. Figure 4.
Bevacizumab-Associated Enterocutaneous Fistula: A Case Report and Management Review

Original figure & article ↗ · CC BY 4.0 ↗

None. Original figure, unmodified; all published panels and annotations retained.

Used in: Bowel perforation / fistula on bevacizumab

File provenance

Source: PubMed Central / U.S. National Library of Medicine. Retrieved 2026-10-28 Retrieved from the official PMC Open Access dataset. This stored copy may not include later source updates. No NLM endorsement.

SHA-256: bbfac4f1b70a2a7a5d47b26d291df43a3262be6103c835527f7eec2816cc5c3e

Abdominal radiograph and CT in intestinal perforation.
treatment example · Figure 2.

Abdominal radiograph and CT in intestinal perforation.

Original context: Bevacizumab plus pembrolizumab in recurrent cervical cancer.

Case-level combination exposure and local tumor/anatomic contributors remain relevant; the image does not isolate drug causality.

Fan Yuanchun, Liu Shihao, Zhao Jiangjing et al.. Medicine (Baltimore). 2025 Apr 11;104(15):e40473. doi: 10.1097/MD.0000000000040473. Figure 2..
Intestinal perforation in recurrent cervical cancer following bevacizumab and pembrolizumab therapy: A case report

Original figure & article ↗ · CC BY 4.0 ↗

None. Original figure, unmodified; all published panels and annotations retained.

Used in: Bowel perforation / fistula on bevacizumab

File provenance

Source: PubMed Central / U.S. National Library of Medicine. Retrieved 2026-10-28 Retrieved from the official PMC Open Access dataset. This stored copy may not include later source updates. No NLM endorsement.

SHA-256: 0f0fd90e3108b57501022887d6bf86796bb2815d8bd212779f7909fdd5ebcb18

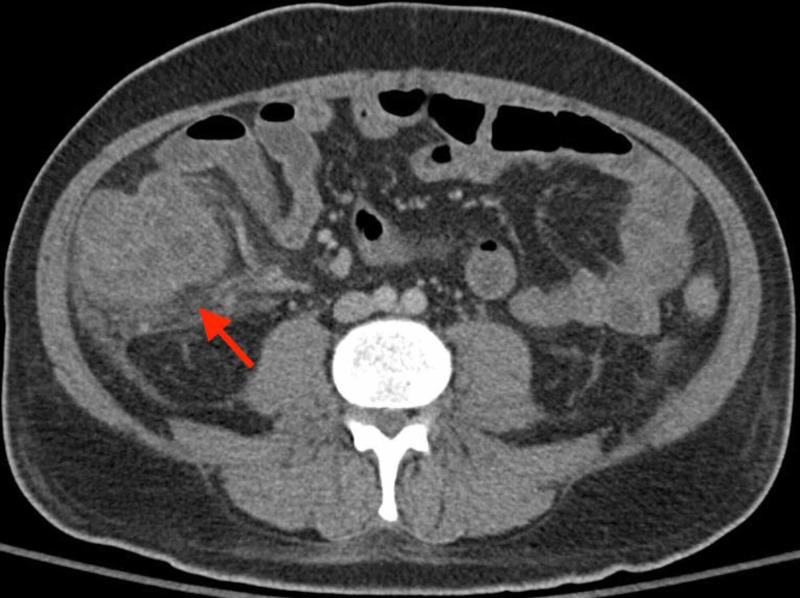
CT ileal wall thickening with interval change.
treatment example · Figure 2

CT ileal wall thickening with interval change.

Original context: Capecitabine during pelvic radiochemotherapy.

Concurrent pelvic irradiation is an important competing/contributing exposure. Both panels are one patient.

Brignoli Andrea, Ferrara Eleonora, Zannetti Micol et al.. Curr Oncol. 2023 Oct 10;30(10):9063–77. doi: 10.3390/curroncol30100655. Figure 2.
Capecitabine-Induced Ileitis during Neoadjuvant Pelvic Radio-Chemotherapy for Locally Advanced Rectal Cancer: A Case Report with Literature Review

Original figure & article ↗ · CC BY 4.0 ↗

None. Original figure, unmodified; all published panels and annotations retained.

Used in: Capecitabine-associated ileitis

File provenance

Source: PubMed Central / U.S. National Library of Medicine. Retrieved 2026-10-28 Retrieved from the official PMC Open Access dataset. This stored copy may not include later source updates. No NLM endorsement.

SHA-256: 444836ae3b2e21b297c28a75d08adb9a6d7beca60590ba075300e9c2eca7abb7

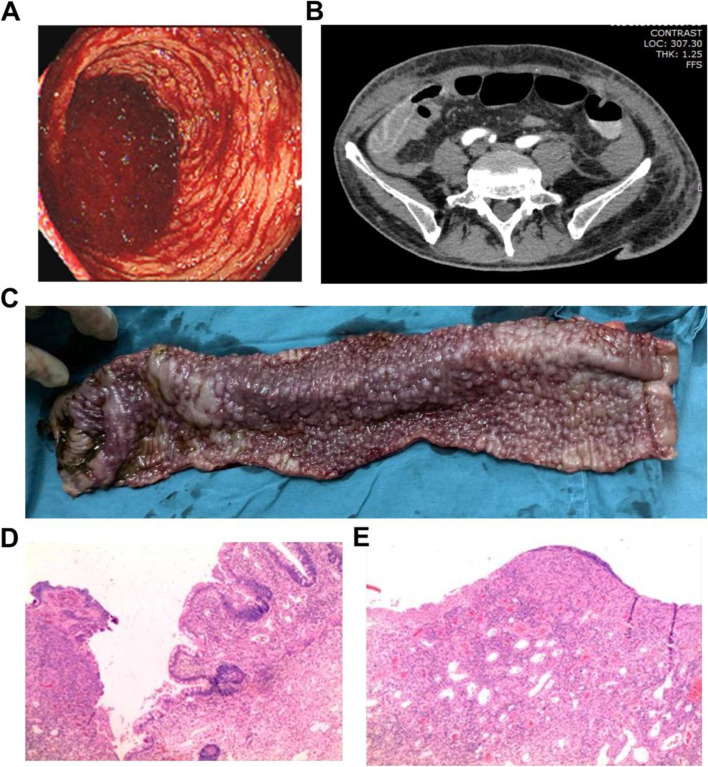
CT panel B shows terminal-ileal edema and adjacent stranding.
treatment example · Fig. 1

CT panel B shows terminal-ileal edema and adjacent stranding.

Original context: Adjuvant capecitabine-containing chemotherapy for colon cancer.

Use the complete unmodified figure; only panel B is radiologic imaging.

Zou You, Liu Shuang, Wu Jianhong et al.. World J Surg Oncol. 2021 Nov 22;19:332. doi: 10.1186/s12957-021-02443-8. Fig. 1.
Severe ileum bleeding following adjuvant capecitabine chemotherapy for locally advanced colon cancer: a case report and review of the literature

Original figure & article ↗ · CC BY 4.0 ↗

None. Original figure, unmodified; all published panels and annotations retained.

Used in: Capecitabine-associated ileitis

File provenance

Source: PubMed Central / U.S. National Library of Medicine. Retrieved 2026-10-28 Retrieved from the official PMC Open Access dataset. This stored copy may not include later source updates. No NLM endorsement.

SHA-256: a53ebf1e0a5fe0c7195dd4ca38c19c2b66eaf3d473979b4e3d8f6d56c5c31c49

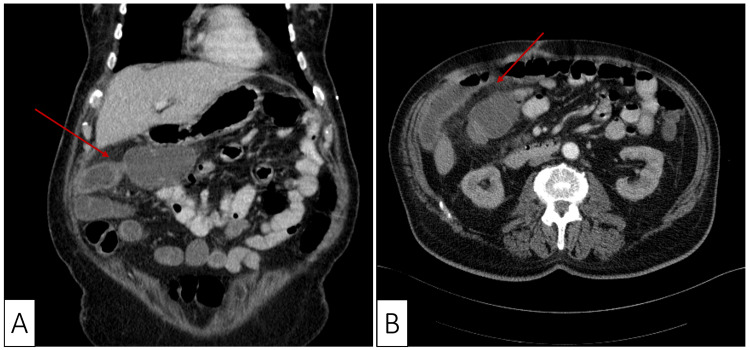
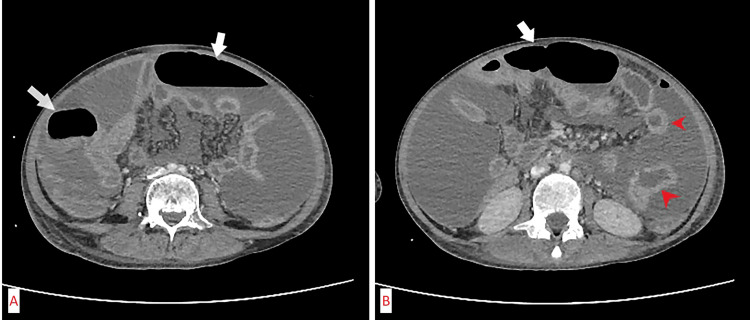
CT bowel injury in neutropenic enterocolitis.
treatment example · Figure 1

CT bowel injury in neutropenic enterocolitis.

Original context: Rituximab/cyclophosphamide/doxorubicin/vincristine/prednisone/methotrexate; concurrent C. difficile infection.

Each source is a different patient. Infection and regimen context are preserved; multiple CT panels are not new cases.

Wiggins Brandon, Sullivan John M, Banno Fady et al.. Cureus. 2025 Jun 16;17(6):e86164. doi: 10.7759/cureus.86164. Figure 1.
Neutropenic Fever Secondary to Concurrent Clostridioides difficile Infection and Neutropenic Enterocolitis

Original figure & article ↗ · CC BY 4.0 ↗

None. Original figure, unmodified; all published panels and annotations retained.

Used in: Neutropenic enterocolitis after chemotherapy

File provenance

Source: PubMed Central / U.S. National Library of Medicine. Retrieved 2026-10-28 Retrieved from the official PMC Open Access dataset. This stored copy may not include later source updates. No NLM endorsement.

SHA-256: f441b89ad0be5e8f765da8afbff7b8975c89d6eece7015a278c2841dafca6487

CT bowel injury in neutropenic enterocolitis.
treatment example · Figure 1

CT bowel injury in neutropenic enterocolitis.

Original context: AML induction chemotherapy in a 12-year-old boy.

Each source is a different patient. Infection and regimen context are preserved; multiple CT panels are not new cases.

Zvizdic Zlatan, Jonuzi Asmir, Pilav Lejla et al.. Cureus. 2024 Oct 16;16(10):e71636. doi: 10.7759/cureus.71636. Figure 1.
Chemotherapy-Induced Jejunal Perforations as an Atypical Presentation of Neutropenic Enterocolitis in an Acute Leukemia Patient

Original figure & article ↗ · CC BY 4.0 ↗

None. Original figure, unmodified; all published panels and annotations retained.

Used in: Neutropenic enterocolitis after chemotherapy

File provenance

Source: PubMed Central / U.S. National Library of Medicine. Retrieved 2026-10-28 Retrieved from the official PMC Open Access dataset. This stored copy may not include later source updates. No NLM endorsement.

SHA-256: 13ef8980c1baeb462c6f59fff2d561f3c5bc83d9e7e9e89056715f95c9b749a8

CT bowel injury in neutropenic enterocolitis.
treatment example · Figure 1

CT bowel injury in neutropenic enterocolitis.

Original context: AML induction chemotherapy.

Each source is a different patient. Infection and regimen context are preserved; multiple CT panels are not new cases.

Groudan Kevin, Ready Audrey, Sabir Riffat. Cureus. 2021 Jan 31;13(1):e13029. doi: 10.7759/cureus.13029. Figure 1.
Neutropenic Enterocolitis Complicating Induction Chemotherapy in an Acute Myeloid Leukemia Patient

Original figure & article ↗ · CC BY 3.0 ↗

None. Original figure, unmodified; all published panels and annotations retained.

Used in: Neutropenic enterocolitis after chemotherapy

File provenance

Source: PubMed Central / U.S. National Library of Medicine. Retrieved 2026-10-28 Retrieved from the official PMC Open Access dataset. This stored copy may not include later source updates. No NLM endorsement.

SHA-256: 5699c9dcc77df274b9c5e634a2f606d674f00a8a38bb9cad961479ddc59675b9

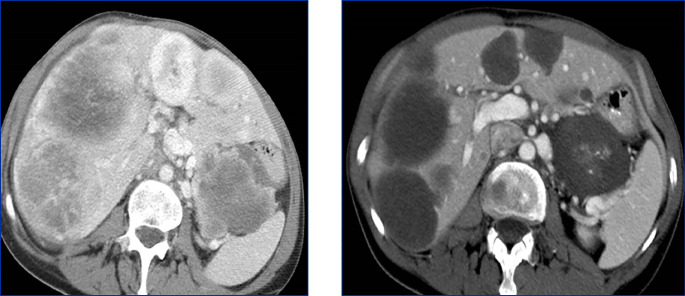
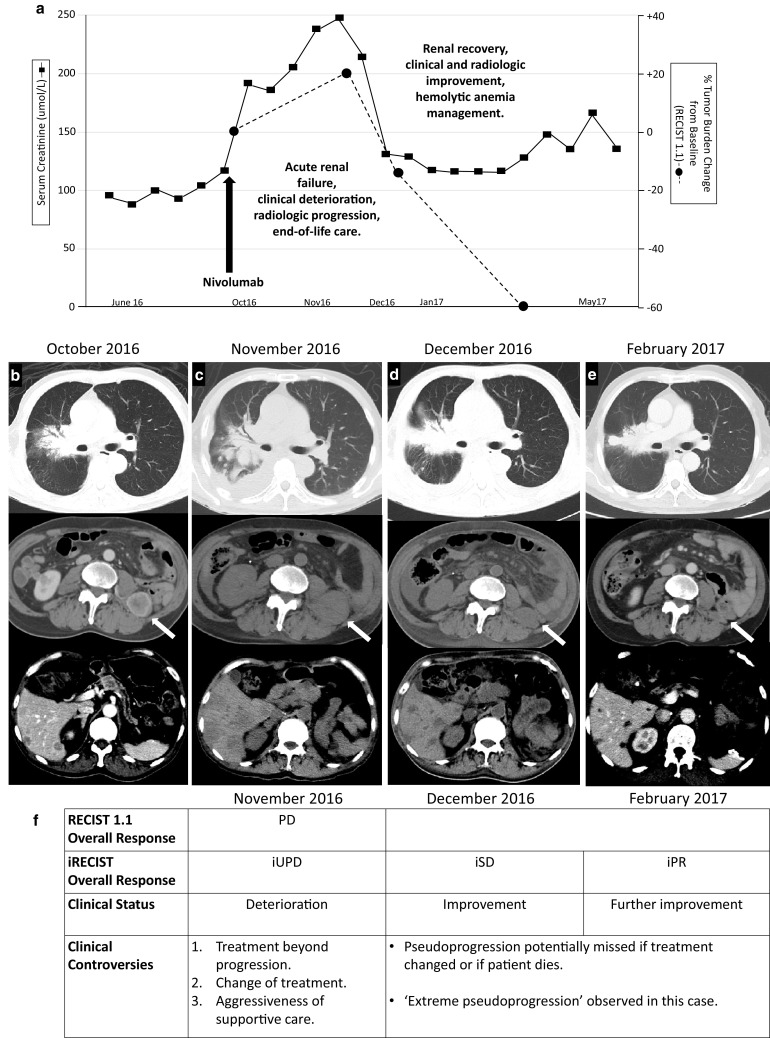
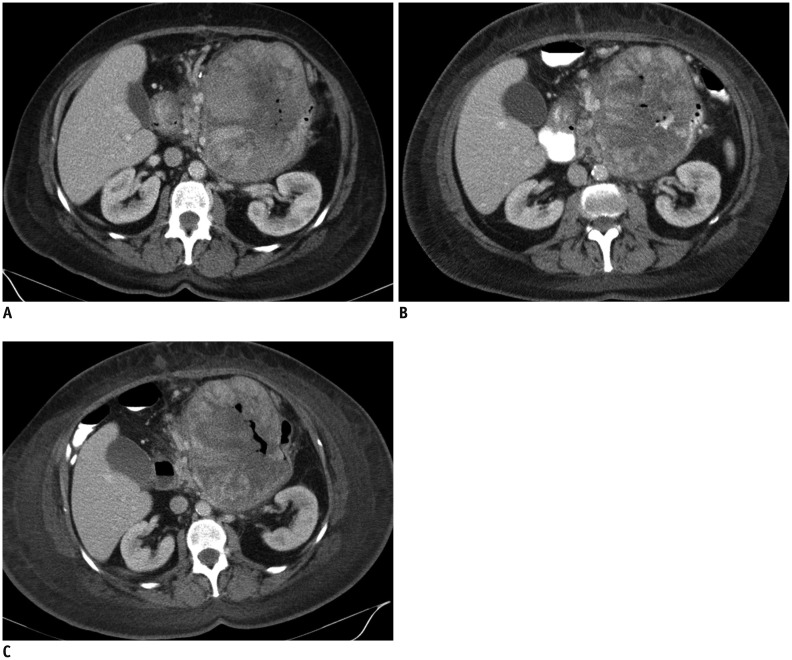
CT response predominantly reflected by lower tumor attenuation.
treatment example · Figure 2

CT response predominantly reflected by lower tumor attenuation.

Original context: Imatinib in a 66-year-old GIST patient.

Response examples address different features; they are not interchangeable diagnostic rules. Cross-publication patient overlap cannot be excluded when ages/identifiers are not reported.

Fournier Laure, de Geus-Oei Lioe-Fee, Regge Daniele et al.. Front Oncol. 2022 Jan 10;11:800547. doi: 10.3389/fonc.2021.800547. Figure 2.
Twenty Years On: RECIST as a Biomarker of Response in Solid Tumours an EORTC Imaging Group – ESOI Joint Paper

Original figure & article ↗ · CC BY 4.0 ↗

None. Original figure, unmodified; all published panels and annotations retained.

Used in: Imatinib response beyond tumour size

File provenance

Source: PubMed Central / U.S. National Library of Medicine. Retrieved 2026-10-28 Retrieved from the official PMC Open Access dataset. This stored copy may not include later source updates. No NLM endorsement.

SHA-256: 5bedcc6dcf0777f82caf4562cdfd6f3bdf282c93aea1bcf5a48ac47e7f704881

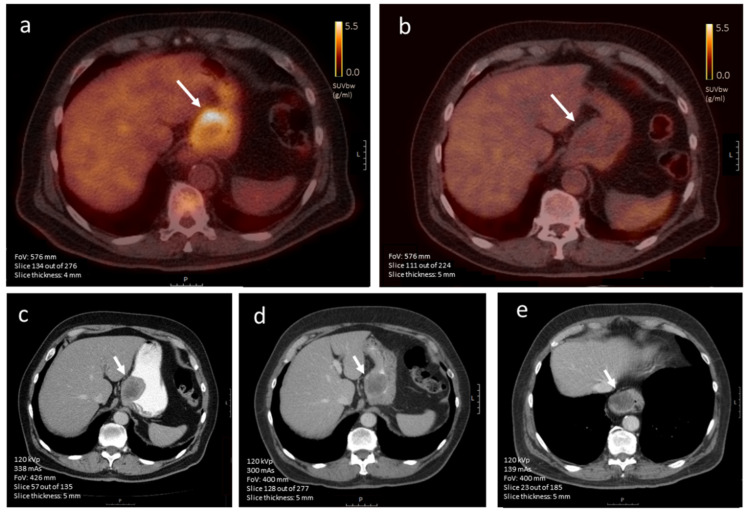
PET metabolic response despite little tumor-size change on CT.
treatment example · Figure 7

PET metabolic response despite little tumor-size change on CT.

Original context: Imatinib in a 71-year-old man with primary gastric GIST.

Response examples address different features; they are not interchangeable diagnostic rules. Cross-publication patient overlap cannot be excluded when ages/identifiers are not reported.

Weeda Ylva. A., Kalisvaart Gijsbert M., van Velden Floris H. P. et al.. Diagnostics (Basel). 2022 Nov 7;12(11):2722. doi: 10.3390/diagnostics12112722. Figure 7.
Early Prediction and Monitoring of Treatment Response in Gastrointestinal Stromal Tumors by Means of Imaging: A Systematic Review

Original figure & article ↗ · CC BY 4.0 ↗

None. Original figure, unmodified; all published panels and annotations retained.

Used in: Imatinib response beyond tumour size

File provenance

Source: PubMed Central / U.S. National Library of Medicine. Retrieved 2026-10-28 Retrieved from the official PMC Open Access dataset. This stored copy may not include later source updates. No NLM endorsement.

SHA-256: 55841e1950f14eeacd8bc3861c2905ed8decb9e1b4926b35cb472c0efeae3d01

CT shows altered tumor attachment after imatinib.
treatment example · Fig. 2

CT shows altered tumor attachment after imatinib.

Original context: Neoadjuvant imatinib in high-risk gastric GIST.

Response examples address different features; they are not interchangeable diagnostic rules. Cross-publication patient overlap cannot be excluded when ages/identifiers are not reported.

Weeda Ylva A., Kalisvaart Gijsbert M., Hartgrink Henk H. et al.. Surg Open Sci. 2024 Jul 14;20:169–77. doi: 10.1016/j.sopen.2024.07.002. Fig. 2.
Monitoring neoadjuvant treatment-induced surgical benefit in GIST patients using CT-based radiological criteria

Original figure & article ↗ · CC BY 4.0 ↗

None. Original figure, unmodified; all published panels and annotations retained.

Used in: Imatinib response beyond tumour size

File provenance

Source: PubMed Central / U.S. National Library of Medicine. Retrieved 2026-10-28 Retrieved from the official PMC Open Access dataset. This stored copy may not include later source updates. No NLM endorsement.

SHA-256: a1d0baae640b90c6daea7e314286a90f0d58f510932faebab24d2ba2d622b935

CT example with limited treatment-related surgical benefit.
treatment example · Fig. 3

CT example with limited treatment-related surgical benefit.

Original context: Neoadjuvant imatinib in large high-risk gastric GIST.

Response examples address different features; they are not interchangeable diagnostic rules. Cross-publication patient overlap cannot be excluded when ages/identifiers are not reported.

Weeda Ylva A., Kalisvaart Gijsbert M., Hartgrink Henk H. et al.. Surg Open Sci. 2024 Jul 14;20:169–77. doi: 10.1016/j.sopen.2024.07.002. Fig. 3.
Monitoring neoadjuvant treatment-induced surgical benefit in GIST patients using CT-based radiological criteria

Original figure & article ↗ · CC BY 4.0 ↗

None. Original figure, unmodified; all published panels and annotations retained.

Used in: Imatinib response beyond tumour size

File provenance

Source: PubMed Central / U.S. National Library of Medicine. Retrieved 2026-10-28 Retrieved from the official PMC Open Access dataset. This stored copy may not include later source updates. No NLM endorsement.

SHA-256: 325e9927246ec4064c86799a5e29b2cb220694753ce55e32f26a1709a7032d7e

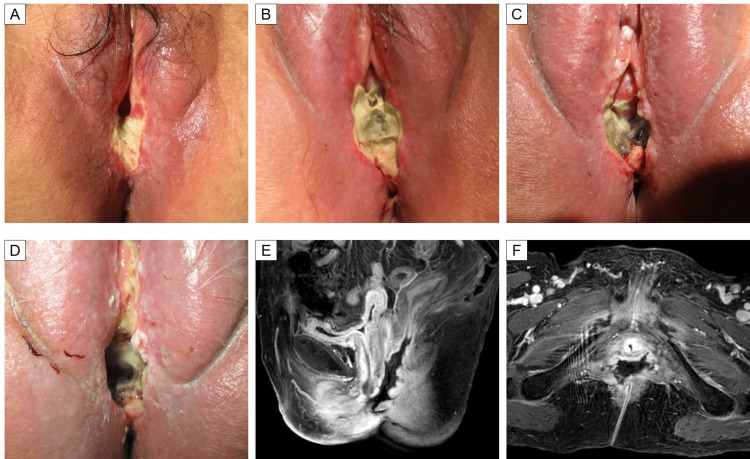
MRI panels E/F show rectovaginal tissue loss and fistula.
treatment example · Figure 5

MRI panels E/F show rectovaginal tissue loss and fistula.

Original context: Lenvatinib plus pembrolizumab after pelvic brachytherapy.

Original full figure also contains clinical photographs. Prior radiotherapy, tumor and combination therapy prevent isolated agent attribution.

Baba Keiichiro, Sumiya Taisuke, Saito Takashi et al.. Cureus. 2025 May 5;17(5):e83541. doi: 10.7759/cureus.83541. Figure 5.
Lenvatinib-Associated Vaginal Necrosis and Rectovaginal Fistula After Brachytherapy

Original figure & article ↗ · CC BY 4.0 ↗

None. Original figure, unmodified; all published panels and annotations retained.

Used in: Fistula / organ perforation on lenvatinib

File provenance

Source: PubMed Central / U.S. National Library of Medicine. Retrieved 2026-10-28 Retrieved from the official PMC Open Access dataset. This stored copy may not include later source updates. No NLM endorsement.

SHA-256: 29bb5c86a6cc7671defcb103e36bd2b4524cc16e1ba98d1c46e276e2a081c04f

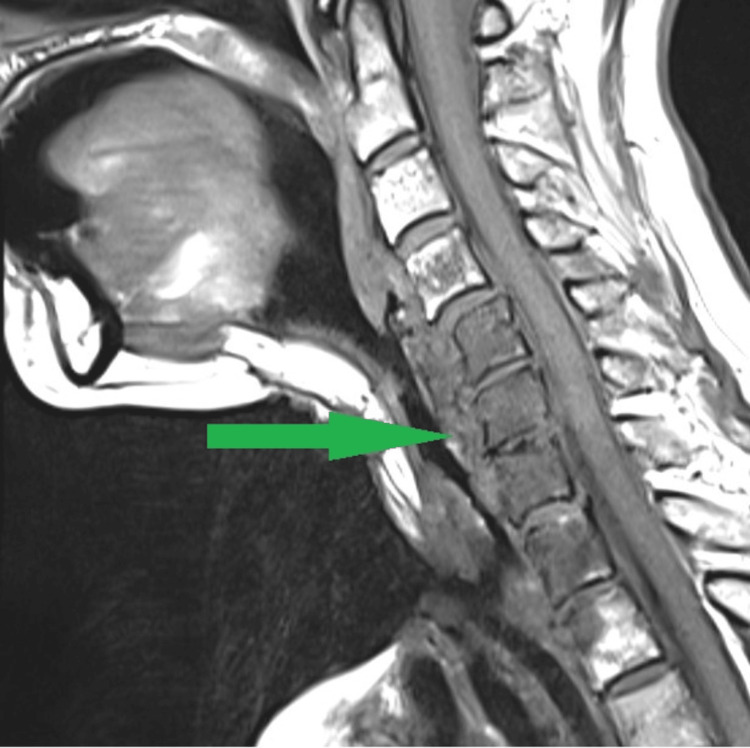
MRI retropharyngeal abscess after enlargement of a pre-existing TEP tract.
treatment example · Figure 3

MRI retropharyngeal abscess after enlargement of a pre-existing TEP tract.

Original context: Lenvatinib in previously operated laryngeal adenoid cystic carcinoma with tracheoesophageal puncture.

Complication-context image; it depicts the downstream abscess, not the fistula tract itself.

Salvatori Sarah, Tanvetyanon Tawee. Cureus. 2023 Aug 14;15(8):e43490. doi: 10.7759/cureus.43490. Figure 3.
Fatal Tracheoesophageal Puncture Leakage Associated With Lenvatinib

Original figure & article ↗ · CC BY 3.0 ↗

None. Original figure, unmodified; all published panels and annotations retained.

Used in: Fistula / organ perforation on lenvatinib

File provenance

Source: PubMed Central / U.S. National Library of Medicine. Retrieved 2026-10-28 Retrieved from the official PMC Open Access dataset. This stored copy may not include later source updates. No NLM endorsement.

SHA-256: d61673bddee9d9e265bc3563ac5bb514c52fc8ebeda60a289c3f1709635b215a

CT renal enlargement and hypoattenuating lesions in an interstitial-nephritis pattern.
treatment example · Fig. 2

CT renal enlargement and hypoattenuating lesions in an interstitial-nephritis pattern.

Original context: High-dose cisplatin combination in a 43-year-old man.

Different renal injury patterns from three separate patients; these are not a single diagnostic cisplatin signature.

Jia Jemianne Bautista, Lall Chandana, Tirkes Temel et al.. Insights Imaging. 2015 Jul 11;6(4):479–87. doi: 10.1007/s13244-015-0417-x. Fig. 2.
Chemotherapy-related complications in the kidneys and collecting system: an imaging perspective

Original figure & article ↗ · CC BY 4.0 ↗

None. Original figure, unmodified; all published panels and annotations retained.

Used in: Cisplatin-associated renal injury · ICI-related nephritis: imaging clues

File provenance

Source: PubMed Central / U.S. National Library of Medicine. Retrieved 2026-10-28 Retrieved from the official PMC Open Access dataset. This stored copy may not include later source updates. No NLM endorsement.

SHA-256: e8edff8b8de70528a9aaf465d7a63fedd3ceba1f518f4f52387ecda654459d5b

CT renal infarct after combination chemotherapy.
treatment example · Fig. 5

CT renal infarct after combination chemotherapy.

Original context: Bleomycin/etoposide/cisplatin in a 54-year-old man.

Different renal injury patterns from three separate patients; these are not a single diagnostic cisplatin signature.

Jia Jemianne Bautista, Lall Chandana, Tirkes Temel et al.. Insights Imaging. 2015 Jul 11;6(4):479–87. doi: 10.1007/s13244-015-0417-x. Fig. 5.
Chemotherapy-related complications in the kidneys and collecting system: an imaging perspective

Original figure & article ↗ · CC BY 4.0 ↗

None. Original figure, unmodified; all published panels and annotations retained.

Used in: Cisplatin-associated renal injury

File provenance

Source: PubMed Central / U.S. National Library of Medicine. Retrieved 2026-10-28 Retrieved from the official PMC Open Access dataset. This stored copy may not include later source updates. No NLM endorsement.

SHA-256: b9b086f0683b7dc7f25c72cde23cead11364380da81ce52e087b8292455d324c

CT persistent renal contrast in acute tubular injury.
treatment example · Fig. 6

CT persistent renal contrast in acute tubular injury.

Original context: Cisplatin plus fluorouracil in an 80-year-old woman.

Different renal injury patterns from three separate patients; these are not a single diagnostic cisplatin signature.

Jia Jemianne Bautista, Lall Chandana, Tirkes Temel et al.. Insights Imaging. 2015 Jul 11;6(4):479–87. doi: 10.1007/s13244-015-0417-x. Fig. 6.
Chemotherapy-related complications in the kidneys and collecting system: an imaging perspective

Original figure & article ↗ · CC BY 4.0 ↗

None. Original figure, unmodified; all published panels and annotations retained.

Used in: Cisplatin-associated renal injury

File provenance

Source: PubMed Central / U.S. National Library of Medicine. Retrieved 2026-10-28 Retrieved from the official PMC Open Access dataset. This stored copy may not include later source updates. No NLM endorsement.

SHA-256: 387062f84a85df306705dfa5351cd101e780d3d690fdaebe0a7e2e90c2bacfad

CT enlargement and hypoattenuation in interstitial nephritis.
pattern example · Fig. 3

CT enlargement and hypoattenuation in interstitial nephritis.

Original context: Carmustine-containing combination in a 65-year-old woman.

Chemotherapy-associated interstitial-nephritis pattern only; no ICI exposure.

Jia Jemianne Bautista, Lall Chandana, Tirkes Temel et al.. Insights Imaging. 2015 Jul 11;6(4):479–87. doi: 10.1007/s13244-015-0417-x. Fig. 3.
Chemotherapy-related complications in the kidneys and collecting system: an imaging perspective

Original figure & article ↗ · CC BY 4.0 ↗

None. Original figure, unmodified; all published panels and annotations retained.

Used in: ICI-related nephritis: imaging clues

File provenance

Source: PubMed Central / U.S. National Library of Medicine. Retrieved 2026-10-28 Retrieved from the official PMC Open Access dataset. This stored copy may not include later source updates. No NLM endorsement.

SHA-256: 0e8def7a1345e5a9df2dea7ffa54b17d7da948423efae34a4958d3ff07a5546e

Increased renal-parenchymal FDG uptake during ICI-associated interstitial nephritis.
treatment example · Fig. 2

Increased renal-parenchymal FDG uptake during ICI-associated interstitial nephritis.

Original context: Ipilimumab plus nivolumab, then nivolumab monotherapy.

Serial PET scans from one patient. This case does not establish sensitivity or replace biochemical/pathological assessment.

Qualls David, Seethapathy Harish, Bates Halla et al.. J Immunother Cancer. 2019 Dec 21;7:356. doi: 10.1186/s40425-019-0820-9. Fig. 2.
Positron emission tomography as an adjuvant diagnostic test in the evaluation of checkpoint inhibitor-associated acute interstitial nephritis

Original figure & article ↗ · CC BY 4.0 ↗

None. Original figure, unmodified; all published panels and annotations retained.

Used in: ICI-related nephritis: imaging clues

File provenance

Source: PubMed Central / U.S. National Library of Medicine. Retrieved 2026-10-28 Retrieved from the official PMC Open Access dataset. This stored copy may not include later source updates. No NLM endorsement.

SHA-256: d320fad9cf1a0c078970e121972b470ac04492ff6b735bf0f65e8ff2170e802e

CT urogram shows asymmetric bladder-wall thickening.
treatment example · Figure 1

CT urogram shows asymmetric bladder-wall thickening.

Original context: BK-virus hemorrhagic cystitis after allogeneic HCT with GVHD in a 31-year-old man.

Mohamed Jiffry Mohamed Zakee, Rangsipat Napat, Tabares Daniel et al.. Cureus. 2023 Feb 24;15(2):e35413. doi: 10.7759/cureus.35413. Figure 1.
BK-Virus-Induced Hemorrhagic Cystitis in a Patient With Graft-Versus-Host Disease

Original figure & article ↗ · CC BY 3.0 ↗

None. Original figure, unmodified; all published panels and annotations retained.

Used in: Haemorrhagic cystitis after HCT · Cyclophosphamide-associated hemorrhagic cystitis · Ifosfamide-associated hemorrhagic cystitis

File provenance

Source: PubMed Central / U.S. National Library of Medicine. Retrieved 2026-10-28 Retrieved from the official PMC Open Access dataset. This stored copy may not include later source updates. No NLM endorsement.

SHA-256: a844f2a21ff62222049063e109f209872de178de8def0dd0164ae7b38fe80563

Focal sternal FDG uptake after chemotherapy and G-CSF.
treatment example · Figure 3

Focal sternal FDG uptake after chemotherapy and G-CSF.

Original context: Pegfilgrastim during breast-cancer chemotherapy.

Focal, atypical reactive uptake; not the usual diffuse marrow pattern.

Hayashi Kumiko, Fujioka Tomoyuki, Hara Masatake et al.. Diagnostics (Basel). 2022 Sep 25;12(10):2308. doi: 10.3390/diagnostics12102308. Figure 3.
Focal Uptake in the Sternum on 18F-FDG-PET/CT Caused by G-CSF Therapy after Chemotherapy Mimicking Bone Metastasis of Breast Cancer

Original figure & article ↗ · CC BY 4.0 ↗

None. Original figure, unmodified; all published panels and annotations retained.

Used in: Diffuse marrow & splenic FDG uptake · Marrow FDG activation after filgrastim

File provenance

Source: PubMed Central / U.S. National Library of Medicine. Retrieved 2026-10-28 Retrieved from the official PMC Open Access dataset. This stored copy may not include later source updates. No NLM endorsement.

SHA-256: 0ab73cf83684a850dbab6ae0e41f9ddc3f1052fe4c0411cb2568be047ec2997b

PET marrow and splenic activation during G-CSF-supported chemotherapy.
pattern example · Fig. 2

PET marrow and splenic activation during G-CSF-supported chemotherapy.

Original context: Lenograstim during R-ACVBP in a 52-year-old man.

This is lenograstim, not filgrastim or pegfilgrastim. Timing belongs to the original regimen and cannot be transferred.

Oliveira Magno, Lasnon Charline, Nganoa Catherine et al.. EJNMMI Res. 2019 Aug 20;9:79. doi: 10.1186/s13550-019-0546-1. Fig. 2.
Comprehensive analysis of the influence of G-CSF on the biodistribution of 18F-FDG in lymphoma patients: insights for PET/CT scheduling

Original figure & article ↗ · CC BY 4.0 ↗

None. Original figure, unmodified; all published panels and annotations retained.

Used in: Diffuse marrow & splenic FDG uptake · Marrow FDG activation after filgrastim

File provenance

Source: PubMed Central / U.S. National Library of Medicine. Retrieved 2026-10-28 Retrieved from the official PMC Open Access dataset. This stored copy may not include later source updates. No NLM endorsement.

SHA-256: 433830ad80845be9e23482a12a60ffc865b1eae7c07a5ba846e225efc7fd7174

CT bilateral pleural effusions during imatinib treatment.
treatment example · Figure 3

CT bilateral pleural effusions during imatinib treatment.

Original context: Imatinib for GIST; concurrent cancer history and treatment are described in the source.

Serial radiographs in this article are the same patient; malignancy, infection and cardiac causes required evaluation.

Pachika Pranali S, Dande Ranadheer R, Ngo Phuong. Cureus. 2025 Apr 28;17(4):e83153. doi: 10.7759/cureus.83153. Figure 3.
Imatinib-Induced Recurrent Pleural Effusions

Original figure & article ↗ · CC BY 4.0 ↗

None. Original figure, unmodified; all published panels and annotations retained.

Used in: Imatinib-associated fluid retention · Docetaxel-associated fluid retention

File provenance

Source: PubMed Central / U.S. National Library of Medicine. Retrieved 2026-10-28 Retrieved from the official PMC Open Access dataset. This stored copy may not include later source updates. No NLM endorsement.

SHA-256: 6207784f108108d009728eae8f9951da886f2ddcf444563ce88cd07a6f2be937

Cardiopulmonary MRI mapping during high-dose IL-2 therapy.
pattern example · Figure 1

Cardiopulmonary MRI mapping during high-dose IL-2 therapy.

Original context: High-dose IL-2; specific product not named in the source.

Clinical MRI/perfusion mapping, not a schematic. Source does not link panels to separately identified patients; count at most one case, not eight. IL-2 tissue injury can coexist with vascular leak.

Lagan Jakub, Naish Josephine H., Fortune Christien et al.. Diagnostics (Basel). 2022 May 30;12(6):1352. doi: 10.3390/diagnostics12061352. Figure 1.
Acute and Chronic Cardiopulmonary Effects of High Dose Interleukin-2 Therapy: An Observational Magnetic Resonance Imaging Study

Original figure & article ↗ · CC BY 4.0 ↗

None. Original figure, unmodified; all published panels and annotations retained.

Used in: Aldesleukin-associated capillary leak

File provenance

Source: PubMed Central / U.S. National Library of Medicine. Retrieved 2026-10-28 Retrieved from the official PMC Open Access dataset. This stored copy may not include later source updates. No NLM endorsement.

SHA-256: 49b2ea64d07677bad3632a30d922fee4efaf559291713093c93dfce5f32fa8c4

FDG-avid hilar/mediastinal nodes in source patient 1.
treatment example · Fig. 1

FDG-avid hilar/mediastinal nodes in source patient 1.

Original context: Pembrolizumab after previous ipilimumab.

Full original figure includes clinical/pathology correlation where present. Three source figures identify three different patients.

Tetzlaff Michael T., Nelson Kelly C., Diab Adi et al.. J Immunother Cancer. 2018 Feb 12;6:14. doi: 10.1186/s40425-018-0323-0. Fig. 1.
Granulomatous/sarcoid-like lesions associated with checkpoint inhibitors: a marker of therapy response in a subset of melanoma patients

Original figure & article ↗ · CC BY 4.0 ↗

None. Original figure, unmodified; all published panels and annotations retained.

Used in: Sarcoid-like thoracic lymphadenopathy

File provenance

Source: PubMed Central / U.S. National Library of Medicine. Retrieved 2026-10-28 Retrieved from the official PMC Open Access dataset. This stored copy may not include later source updates. No NLM endorsement.

SHA-256: 02b9a3bfae3f4c58a527d0eb8b7e8c02218327e10b686468663eb0ef687ebc7b

FDG-avid hilar/mediastinal nodes in source patient 3.
treatment example · Fig. 3

FDG-avid hilar/mediastinal nodes in source patient 3.

Original context: Pembrolizumab.

Full original figure includes clinical/pathology correlation where present. Three source figures identify three different patients.

Tetzlaff Michael T., Nelson Kelly C., Diab Adi et al.. J Immunother Cancer. 2018 Feb 12;6:14. doi: 10.1186/s40425-018-0323-0. Fig. 3.
Granulomatous/sarcoid-like lesions associated with checkpoint inhibitors: a marker of therapy response in a subset of melanoma patients

Original figure & article ↗ · CC BY 4.0 ↗

None. Original figure, unmodified; all published panels and annotations retained.

Used in: Sarcoid-like thoracic lymphadenopathy

File provenance

Source: PubMed Central / U.S. National Library of Medicine. Retrieved 2026-10-28 Retrieved from the official PMC Open Access dataset. This stored copy may not include later source updates. No NLM endorsement.

SHA-256: 0f32f3ea6b7657de7681f42c606cfd81eac0d705b92a62066a3675231521c57b

CT apparent progression followed by multisite regression.
treatment example · Fig. 1

CT apparent progression followed by multisite regression.

Original context: Nivolumab in metastatic malignancy.

Confirmatory response from serial clinical imaging in one patient. Repeated episodes or follow-up scans must not be counted as new cases; clinical decisions cannot be inferred from the figure alone.

Wong Alvin S., Thian Yee-Liang, Kapur Jeevesh et al.. Cancer Immunol Immunother. 2018 May 4;67(7):1105–11. doi: 10.1007/s00262-018-2167-3. Fig. 1.
Pushing the limits of immune-related response: a case of “extreme pseudoprogression”

Original figure & article ↗ · CC BY 4.0 ↗

None. Original figure, unmodified; all published panels and annotations retained.

Used in: Apparent progression on immunotherapy

File provenance

Source: PubMed Central / U.S. National Library of Medicine. Retrieved 2026-10-28 Retrieved from the official PMC Open Access dataset. This stored copy may not include later source updates. No NLM endorsement.

SHA-256: 5476560da32962bc3729f4547b6c97947fc3d8ab521b1e3c0b2746c7408d3fef

Serial CT demonstrates pseudoprogression during combination therapy.
treatment example · Fig. 1

Serial CT demonstrates pseudoprogression during combination therapy.

Original context: Carboplatin/pemetrexed/pembrolizumab in NSCLC.

Confirmatory response from serial clinical imaging in one patient. Repeated episodes or follow-up scans must not be counted as new cases; clinical decisions cannot be inferred from the figure alone.

Gonugunta Amrit S., von Itzstein Mitchell S., Gerber David E.. J Med Case Rep. 2022 Jul 25;16:289. doi: 10.1186/s13256-022-03485-6. Fig. 1.
Pseudoprogression in advanced non-small cell lung cancer treated with combination chemoimmunotherapy: a case report

Original figure & article ↗ · CC BY 4.0 ↗

None. Original figure, unmodified; all published panels and annotations retained.

Used in: Apparent progression on immunotherapy

File provenance

Source: PubMed Central / U.S. National Library of Medicine. Retrieved 2026-10-28 Retrieved from the official PMC Open Access dataset. This stored copy may not include later source updates. No NLM endorsement.

SHA-256: 809950fa0b9edc41bf4acb3f2799ba4c21b4d6018617b039d0daae7f948d7f71

FDG-PET pseudoprogression with confirmatory follow-up.
treatment example · Figure 1

FDG-PET pseudoprogression with confirmatory follow-up.

Original context: Pembrolizumab in metastatic uveal melanoma.

Confirmatory response from serial clinical imaging in one patient. Repeated episodes or follow-up scans must not be counted as new cases; clinical decisions cannot be inferred from the figure alone.

Amrane Karim, Le Meur Coline, Thuillier Philippe et al.. Front Immunol. 2023 Dec 4;14:1243208. doi: 10.3389/fimmu.2023.1243208. Figure 1.
Case Report: Long-term metabolic response of metastatic uveal melanoma to pembrolizumab on FDG-PET/CT despite a serial pseudoprogressions phenomenon

Original figure & article ↗ · CC BY 4.0 ↗

None. Original figure, unmodified; all published panels and annotations retained.

Used in: Apparent progression on immunotherapy

File provenance

Source: PubMed Central / U.S. National Library of Medicine. Retrieved 2026-10-28 Retrieved from the official PMC Open Access dataset. This stored copy may not include later source updates. No NLM endorsement.

SHA-256: d8ecbb1c1a1a5c9bc1b91fca061aaeeaae4b1d7a3d4eba3269828f87f575bbc1

Transvaginal ultrasound and elastography illustrate endometrial measurement.
treatment example · Figure 1

Transvaginal ultrasound and elastography illustrate endometrial measurement.

Original context: Tamoxifen-treated study population; individual figure patient not identified.

Figures 1 and 2 do not establish separate patient identities; only one conservative example is counted. This is not a screening recommendation.

Jabłoński Krzysztof, Kurek Łukasz, Żukowski Maciej et al.. J Clin Med. 2020 Nov 28;9(12):3870. doi: 10.3390/jcm9123870. Figure 1.
Elastography of Endometrium in Women Taking Tamoxifen: A New Approach to an Old Diagnostic Problem

Original figure & article ↗ · CC BY 4.0 ↗

None. Original figure, unmodified; all published panels and annotations retained.

Used in: Tamoxifen-associated endometrial changes

File provenance

Source: PubMed Central / U.S. National Library of Medicine. Retrieved 2026-10-28 Retrieved from the official PMC Open Access dataset. This stored copy may not include later source updates. No NLM endorsement.

SHA-256: e033bac2f40f87cef7c48e08c0529ba14b839b615b9f20c6e5eed3c1eddc651e

CT uterine-cavity lesion in a patient with an endometrial polyp.
treatment example · Figure 1

CT uterine-cavity lesion in a patient with an endometrial polyp.

Original context: Tamoxifen history in a 58-year-old woman; concurrent leiomyoma.

Structural image is not a histologic cancer diagnosis.

Apornvirat Sompon, Suwannarurk Komsun. Case Rep Obstet Gynecol. 2024 Jul 8;2024:9826447. doi: 10.1155/2024/9826447. Figure 1.
Fifteen-Centimeter Giant Tamoxifen-Associated Endometrial Polyp Presenting With Constipation: A Case Report and Review of the Literature

Original figure & article ↗ · CC BY 4.0 ↗

None. Original figure, unmodified; all published panels and annotations retained.

Used in: Tamoxifen-associated endometrial changes

File provenance

Source: PubMed Central / U.S. National Library of Medicine. Retrieved 2026-10-28 Retrieved from the official PMC Open Access dataset. This stored copy may not include later source updates. No NLM endorsement.

SHA-256: 59b7f312a843cab503a8f8b919daffbaf5dd807764bea75dc420ee7b1e23cd16

Jaw CT/CBCT findings in source case 1.
treatment example · Figure 1

Jaw CT/CBCT findings in source case 1.

Original context: Bisphosphonate plus denosumab in multiple myeloma; 76-year-old woman.

Repeat operations/follow-up in one figure remain one case. Source calls the prior bisphosphonate BP; it does not name zoledronic acid. Clinical criteria establish MRONJ.

Sawada Shunsuke, Sakamoto Yuki, Kirihigashi Mako et al.. Cureus. 2024 Jun 22;16(6):e62930. doi: 10.7759/cureus.62930. Figure 1.
Postoperative Recurrence of Medication-Related Osteonecrosis of the Jaw: A Retrospective Study of 150 Patients Undergoing Surgery

Original figure & article ↗ · CC BY 4.0 ↗

None. Original figure, unmodified; all published panels and annotations retained.

Used in: Medication-related osteonecrosis of the jaw

File provenance

Source: PubMed Central / U.S. National Library of Medicine. Retrieved 2026-10-28 Retrieved from the official PMC Open Access dataset. This stored copy may not include later source updates. No NLM endorsement.

SHA-256: a6ffa38ff05360fd10444c9cd4d1df570ca26621bd9381b9222fe303d32fb521

Jaw CT/CBCT findings in source case 3.
treatment example · Figure 3

Jaw CT/CBCT findings in source case 3.

Original context: Denosumab in multiple myeloma; 78-year-old woman.

Repeat operations/follow-up in one figure remain one case. Source calls the prior bisphosphonate BP; it does not name zoledronic acid. Clinical criteria establish MRONJ.

Sawada Shunsuke, Sakamoto Yuki, Kirihigashi Mako et al.. Cureus. 2024 Jun 22;16(6):e62930. doi: 10.7759/cureus.62930. Figure 3.
Postoperative Recurrence of Medication-Related Osteonecrosis of the Jaw: A Retrospective Study of 150 Patients Undergoing Surgery

Original figure & article ↗ · CC BY 4.0 ↗

None. Original figure, unmodified; all published panels and annotations retained.

Used in: Medication-related osteonecrosis of the jaw

File provenance

Source: PubMed Central / U.S. National Library of Medicine. Retrieved 2026-10-28 Retrieved from the official PMC Open Access dataset. This stored copy may not include later source updates. No NLM endorsement.

SHA-256: e0dd23d310f1170e673a076171cbc90baf6318dcdfcb9c2faac06a1bdd8b405b

Renal Doppler/SMI perfusion abnormality in HUS.
pattern example · Figure 3

Renal Doppler/SMI perfusion abnormality in HUS.

Original context: STEC-HUS in a 10-month-old girl; no anticancer drug exposure.

One infant across panels A/B. This is HUS renal-perfusion morphology only, not a gemcitabine/mitomycin case or a validated adult drug-TMA diagnostic pattern.

Rink Lydia, Finkelberg Ilja, Kreuzer Martin et al.. Front Pediatr. 2024 Oct 23;12:1433812. doi: 10.3389/fped.2024.1433812. Figure 3.
Ultrasound analysis of different forms of hemolytic uremic syndrome in children

Original figure & article ↗ · CC BY 4.0 ↗

None. Original figure, unmodified; all published panels and annotations retained.

Used in: Gemcitabine-associated thrombotic microangiopathy · Systemic mitomycin-associated HUS / TMA

File provenance

Source: PubMed Central / U.S. National Library of Medicine. Retrieved 2026-10-28 Retrieved from the official PMC Open Access dataset. This stored copy may not include later source updates. No NLM endorsement.

SHA-256: 749dcd3c3bb50f06e2b29467a09e5d8c483e61a46dbfef3c474497cfa9dee1de

CT endometrial thickening during tamoxifen therapy.
treatment example · Fig. 10

CT endometrial thickening during tamoxifen therapy.

Original context: Tamoxifen in a 72-year-old woman with metastatic breast cancer.

Only panel A illustrates this card; CT appearance does not establish endometrial histology.

Michaels Aya Y., Keraliya Abhishek R., Tirumani Sree Harsha et al.. Insights Imaging. 2015 Nov 13;7(1):131–44. doi: 10.1007/s13244-015-0447-4. Fig. 10.
Systemic treatment in breast cancer: a primer for radiologists

Original figure & article ↗ · CC BY 4.0 ↗

None. Original figure, unmodified; all published panels and annotations retained.

Used in: Tamoxifen-associated endometrial changes

File provenance

Source: PubMed Central / U.S. National Library of Medicine. Retrieved 2026-10-28 Retrieved from the official PMC Open Access dataset. This stored copy may not include later source updates. No NLM endorsement.

SHA-256: 395e4197dc7db7629b593c7e689f3bab91b866165fa126a0c65bc5c644c12962

Serial bone scintigraphy demonstrates treatment-related flare.
pattern example · Fig. 8

Serial bone scintigraphy demonstrates treatment-related flare.

Original context: Capecitabine in a 61-year-old woman with metastatic breast cancer; not abiraterone.

Same scintigraphic flare pattern under a different agent and cancer. Pretreatment and follow-up panels are one patient; rib-trauma sites are labelled in the source.

Michaels Aya Y., Keraliya Abhishek R., Tirumani Sree Harsha et al.. Insights Imaging. 2015 Nov 13;7(1):131–44. doi: 10.1007/s13244-015-0447-4. Fig. 8.
Systemic treatment in breast cancer: a primer for radiologists

Original figure & article ↗ · CC BY 4.0 ↗

None. Original figure, unmodified; all published panels and annotations retained.

Used in: Bone flare during abiraterone therapy

File provenance

Source: PubMed Central / U.S. National Library of Medicine. Retrieved 2026-10-28 Retrieved from the official PMC Open Access dataset. This stored copy may not include later source updates. No NLM endorsement.

SHA-256: 0ee6905510399b8a264879028ede540c1017860993a7b44b8d182c5b1324c026

Slit-lamp and AS-OCT epithelial changes in one belantamab-exposed patient.
treatment example · Fig. 1

Slit-lamp and AS-OCT epithelial changes in one belantamab-exposed patient.

Original context: Belantamab mafodotin for multiply relapsed multiple myeloma; 70-year-old man.

Peripheral-to-central epithelial change and intraepithelial OCT opacities. Serial panels are one patient; original unmodified figure.

Chuang Katherine, Pineda Roberto, Liu Shaohui. Am J Ophthalmol Case Rep. 2022 Feb 2;25:101392. doi: 10.1016/j.ajoc.2022.101392. Fig. 1.
Belantamab mafodotin associated corneal microcyst-like epithelial changes

Original figure & article ↗ · CC BY-NC-ND 4.0 ↗

None. Original figure, unmodified; all published panels and annotations retained.

Used in: Belantamab mafodotin: microcyst-like epithelial keratopathy

File provenance

Source: PubMed Central / U.S. National Library of Medicine. Retrieved 2026-10-28 Retrieved from the official PMC Open Access dataset. This stored copy may not include later source updates. No NLM endorsement.

SHA-256: 4f5562d897ec0cd1a723323bffad7cc878bc35cea950f68f04b6b336efdf8e91

Dedicated corneal imaging in belantamab series patient 3.
treatment example · Fig. 1

Dedicated corneal imaging in belantamab series patient 3.

Original context: Belantamab mafodotin for myeloma; source patient 3.

Slit-lamp, epithelial-thickness mapping and confocal microscopy in the same patient; numbered patients 3 and 7 are explicitly distinct.

Schweighofer Jakob, Agis Hermine, Krauth Maria et al.. Ophthalmol Ther. 2025 May 6;14(7):1453–64. doi: 10.1007/s40123-025-01147-6. Fig. 1.
Corneal Findings in Patients Treated with Belantamab Mafodotin: A Prospective Case Series Focusing on Corneal Nerves

Original figure & article ↗ · CC BY-NC 4.0 ↗

None. Original figure, unmodified; all published panels and annotations retained.

Used in: Belantamab mafodotin: microcyst-like epithelial keratopathy

File provenance

Source: PubMed Central / U.S. National Library of Medicine. Retrieved 2026-10-28 Retrieved from the official PMC Open Access dataset. This stored copy may not include later source updates. No NLM endorsement.

SHA-256: c63969c1eb3a2404b433b8365cf77a2f74d64326e4060a739e08a1a50711a2ae

Dedicated corneal imaging in belantamab series patient 7.
treatment example · Fig. 2

Dedicated corneal imaging in belantamab series patient 7.

Original context: Belantamab mafodotin for myeloma; source patient 7.

Slit-lamp, epithelial-thickness mapping and confocal microscopy in the same patient; numbered patients 3 and 7 are explicitly distinct.

Schweighofer Jakob, Agis Hermine, Krauth Maria et al.. Ophthalmol Ther. 2025 May 6;14(7):1453–64. doi: 10.1007/s40123-025-01147-6. Fig. 2.
Corneal Findings in Patients Treated with Belantamab Mafodotin: A Prospective Case Series Focusing on Corneal Nerves

Original figure & article ↗ · CC BY-NC 4.0 ↗

None. Original figure, unmodified; all published panels and annotations retained.

Used in: Belantamab mafodotin: microcyst-like epithelial keratopathy

File provenance

Source: PubMed Central / U.S. National Library of Medicine. Retrieved 2026-10-28 Retrieved from the official PMC Open Access dataset. This stored copy may not include later source updates. No NLM endorsement.

SHA-256: 81b626a68070a4a16437940debae258e16fbaebb414bd1cb5bfad9263453a465

Serial CT lung injury during disitamab vedotin plus toripalimab.
treatment example · Fig. 2

Serial CT lung injury during disitamab vedotin plus toripalimab.

Original context: Toripalimab plus disitamab vedotin after poorly tolerated gemcitabine/cisplatin for metastatic upper-tract urothelial carcinoma; 76-year-old woman.

All seven panels show one patient. Attribution is limited to the combination; later disitamab-only tolerance and infectious alternatives are retained.

Ding Peng, Lin Huanhuan, Zhang Kaichen et al.. BMC Pulm Med. 2025 Jul 24;25:351. doi: 10.1186/s12890-025-03838-z. Fig. 2.
Interstitial lung disease induced by Toripalimab combined with disitamab Vedotin in upper tract urothelial carcinoma: a case report and literature review

Original figure & article ↗ · CC BY-NC-ND 4.0 ↗

None. Original figure, unmodified; all published panels and annotations retained.

Used in: Pneumonitis during disitamab vedotin plus toripalimab

File provenance

Source: PubMed Central / U.S. National Library of Medicine. Retrieved 2026-10-28 Retrieved from the official PMC Open Access dataset. This stored copy may not include later source updates. No NLM endorsement.

SHA-256: ae29a415057cdebc9cf8b43ba0eb54ae5e4d15e4448fa9b5a6715d0aa6c9d112

Case 1: pleural effusion and follow-up imaging during dasatinib therapy.
pattern example · FIGURE 1

Case 1: pleural effusion and follow-up imaging during dasatinib therapy.

Original context: Dasatinib for chronic myeloid leukemia; numbered case 1.

Follow-up panels are one patient. For the CAR-T card this is an effusion-pattern example from dasatinib, not evidence of CRS.

Vazhoor Vishnu, Pavithran Shruthi Keechilat, Unni Manoj et al.. Respirol Case Rep. 2026 Mar 6;14(3):e70532. doi: 10.1002/rcr2.70532. FIGURE 1.
Dasatinib Associated Pleural Complications‐ A Case Series

Original figure & article ↗ · CC BY 4.0 ↗

None. Original figure, unmodified; all published panels and annotations retained.

Used in: Loncastuximab tesirine: effusions and edema · Pleural effusion during dasatinib therapy · Pleural effusions and thoracic changes during CAR-T CRS

File provenance

Source: PubMed Central / U.S. National Library of Medicine. Retrieved 2026-10-28 Retrieved from the official PMC Open Access dataset. This stored copy may not include later source updates. No NLM endorsement.

SHA-256: be5ebf25c525f19f663930742207cd131174c58471d8b74e86a609708a9e6066

Case 2: pleural effusion and follow-up imaging during dasatinib therapy.
pattern example · FIGURE 2

Case 2: pleural effusion and follow-up imaging during dasatinib therapy.

Original context: Dasatinib for chronic myeloid leukemia; numbered case 2.

Follow-up panels are one patient. For the CAR-T card this is an effusion-pattern example from dasatinib, not evidence of CRS.

Vazhoor Vishnu, Pavithran Shruthi Keechilat, Unni Manoj et al.. Respirol Case Rep. 2026 Mar 6;14(3):e70532. doi: 10.1002/rcr2.70532. FIGURE 2.
Dasatinib Associated Pleural Complications‐ A Case Series

Original figure & article ↗ · CC BY 4.0 ↗

None. Original figure, unmodified; all published panels and annotations retained.

Used in: Loncastuximab tesirine: effusions and edema · Pleural effusion during dasatinib therapy · Pleural effusions and thoracic changes during CAR-T CRS

File provenance

Source: PubMed Central / U.S. National Library of Medicine. Retrieved 2026-10-28 Retrieved from the official PMC Open Access dataset. This stored copy may not include later source updates. No NLM endorsement.

SHA-256: 4de09098b3c2ff4edf8cb070edca252aab481712e62cf0fe800db8377f427963

Case 3: pleural effusion and follow-up imaging during dasatinib therapy.
pattern example · FIGURE 3

Case 3: pleural effusion and follow-up imaging during dasatinib therapy.

Original context: Dasatinib for chronic myeloid leukemia; numbered case 3.

Follow-up panels are one patient. For the CAR-T card this is an effusion-pattern example from dasatinib, not evidence of CRS.

Vazhoor Vishnu, Pavithran Shruthi Keechilat, Unni Manoj et al.. Respirol Case Rep. 2026 Mar 6;14(3):e70532. doi: 10.1002/rcr2.70532. FIGURE 3.
Dasatinib Associated Pleural Complications‐ A Case Series

Original figure & article ↗ · CC BY 4.0 ↗

None. Original figure, unmodified; all published panels and annotations retained.

Used in: Loncastuximab tesirine: effusions and edema · Pleural effusion during dasatinib therapy · Pleural effusions and thoracic changes during CAR-T CRS

File provenance

Source: PubMed Central / U.S. National Library of Medicine. Retrieved 2026-10-28 Retrieved from the official PMC Open Access dataset. This stored copy may not include later source updates. No NLM endorsement.

SHA-256: 95825e1d60dd71fe32473155724b36ace061c49ff6ca3ead3e08801b0ad30cdc

CT shows fibrotic NSIP with reticulation, bronchiectasis and ground-glass opacity in one renal-transplant recipient.
pattern example · Fig. 3

CT shows fibrotic NSIP with reticulation, bronchiectasis and ground-glass opacity in one renal-transplant recipient.

Original context: Sirolimus after renal transplantation; patient had recurrent cutaneous squamous-cell carcinoma. This is not an HCT case.

One source patient. Outside the sirolimus card this illustrates a fibrotic interstitial-injury pattern only.

Ghasemi Golsa, Shahidi Shahrzad. BMC Nephrol. 2024 Nov 12;25:406. doi: 10.1186/s12882-024-03661-4. Fig. 3.
Sirolimus-induced pulmonary toxicity without recurrence more than 8 years after everolimus replacement in a renal transplant patient with recurrent skin SCC: a case report

Original figure & article ↗ · CC BY 4.0 ↗

None. Original figure, unmodified; all published panels and annotations retained.

Used in: Osimertinib-associated ILD / pneumonitis · Abemaciclib-associated ILD / pneumonitis · Alectinib-associated ILD / pneumonitis · Crizotinib-associated lung injury · Enfortumab vedotin-associated pneumonitis · Erlotinib-associated ILD / pneumonitis · Everolimus-related pneumonitis · Gefitinib-associated ILD / pneumonitis · ILD / pneumonitis reported with apalutamide · Olaparib-associated ILD / pneumonitis · Paclitaxel-associated pneumonitis · Palbociclib-associated ILD / pneumonitis · Pemetrexed-associated interstitial pneumonitis · Ribociclib-associated ILD / pneumonitis · Temsirolimus-related pneumonitis · Early pulmonary events on brigatinib · Sirolimus-associated pneumonitis · Delayed lung injury after busulfan · Carmustine-associated pulmonary fibrosis · Melphalan-associated pneumonitis / fibrosis · Bleomycin pneumonitis / fibrosis · T-DXd–associated ILD / pneumonitis

File provenance

Source: PubMed Central / U.S. National Library of Medicine. Retrieved 2026-10-28 Retrieved from the official PMC Open Access dataset. This stored copy may not include later source updates. No NLM endorsement.

SHA-256: 578d9860ad9a01a5c37fd3b6934b3f78679f091b254f103441624aa7c34d54b1

CT OP pattern in a woman receiving letrozole and abemaciclib.
pattern example · Fig. 3

CT OP pattern in a woman receiving letrozole and abemaciclib.

Original context: Letrozole plus abemaciclib for luminal breast cancer, 76-year-old woman.

Combination exposure is retained; a single CT pattern does not establish drug causality.

Yamaguchi Ken, Egashira Ryoko, Nakazono Takahiko et al.. Breast Cancer. 2025 Dec 19;33(1):50–61. doi: 10.1007/s12282-025-01816-1. Fig. 3.
CT findings of lung injury during breast cancer treatment

Original figure & article ↗ · CC BY 4.0 ↗

None. Original figure, unmodified; all published panels and annotations retained.

Used in: Abemaciclib-associated ILD / pneumonitis

File provenance

Source: PubMed Central / U.S. National Library of Medicine. Retrieved 2026-10-28 Retrieved from the official PMC Open Access dataset. This stored copy may not include later source updates. No NLM endorsement.

SHA-256: 0455757daa651114fc94bc0da5bd5c0f643a9b5522adbbed71462bd78f6b25df

Serial CT OP-pattern consolidations in one T-DXd-exposed patient.
pattern example · Fig. 4

Serial CT OP-pattern consolidations in one T-DXd-exposed patient.

Original context: Trastuzumab deruxtecan for luminal/HER2 breast cancer; 76-year-old woman.

Serial scans count as one patient. This patient is not assumed independent of other same-age cases unless the card uses this figure alone.

Yamaguchi Ken, Egashira Ryoko, Nakazono Takahiko et al.. Breast Cancer. 2025 Dec 19;33(1):50–61. doi: 10.1007/s12282-025-01816-1. Fig. 4.
CT findings of lung injury during breast cancer treatment

Original figure & article ↗ · CC BY 4.0 ↗

None. Original figure, unmodified; all published panels and annotations retained.

Used in: T-DXd–associated ILD / pneumonitis

File provenance

Source: PubMed Central / U.S. National Library of Medicine. Retrieved 2026-10-28 Retrieved from the official PMC Open Access dataset. This stored copy may not include later source updates. No NLM endorsement.

SHA-256: e6e53b11c40ce85e31f6e13ba2d2ae98ddf5d76a33b66be121b57dd396d5f374

CT pneumonitis in one 79-year-old man after five nivolumab cycles.
pattern example · Figure 3

CT pneumonitis in one 79-year-old man after five nivolumab cycles.

Original context: Nivolumab for stage IV non-small-cell lung cancer.

Axial and coronal views are the same patient.

Berz Antonia M., Boughdad Sarah, Vietti-Violi Naïk et al.. Front Immunol. 2023 Feb 23;14:1133207. doi: 10.3389/fimmu.2023.1133207. Figure 3.
Imaging assessment of toxicity related to immune checkpoint inhibitors

Original figure & article ↗ · CC BY 4.0 ↗

None. Original figure, unmodified; all published panels and annotations retained.

Used in: Checkpoint-related pneumonitis

File provenance

Source: PubMed Central / U.S. National Library of Medicine. Retrieved 2026-10-28 Retrieved from the official PMC Open Access dataset. This stored copy may not include later source updates. No NLM endorsement.

SHA-256: 84599044a6ccdbe8a2015a9b0544a188378193028ed79d974d01084a50ccb392

CT ground-glass change and bronchiectasis in a nivolumab-exposed patient with concurrent myocarditis.
pattern example · Figure 4

CT ground-glass change and bronchiectasis in a nivolumab-exposed patient with concurrent myocarditis.

Original context: Nivolumab for renal-cell carcinoma; same patient as this article's CMR figure.

CT and CMR in this article describe the same patient.

Fukushima Shuntaro, Okamoto Eisuke, Uchida Toshihiko et al.. Cureus. 2025 Mar 17;17(3):e80732. doi: 10.7759/cureus.80732. Figure 4.
A Case of Nivolumab-Induced Multiorgan Toxicity: Concurrent Myocarditis and Interstitial Pneumonia

Original figure & article ↗ · CC BY 4.0 ↗

None. Original figure, unmodified; all published panels and annotations retained.

Used in: Checkpoint-related pneumonitis

File provenance

Source: PubMed Central / U.S. National Library of Medicine. Retrieved 2026-10-28 Retrieved from the official PMC Open Access dataset. This stored copy may not include later source updates. No NLM endorsement.

SHA-256: 2cf3185443a9d5a31c2cf7ba2d2849caff252f0e7d669c19d247e638eb419496

Two pembrolizumab-exposed patients with different CT pneumonitis patterns.
treatment example · Fig. 2

Two pembrolizumab-exposed patients with different CT pneumonitis patterns.

Original context: Pembrolizumab in NSCLC or melanoma; two explicitly different patients.

Original published case illustration. It does not establish causality or diagnostic specificity in another patient.

Gosangi Babina, McIntosh Lacey, Keraliya Abhishek et al.. Eur J Radiol Open. 2022 Aug 8;9:100434. doi: 10.1016/j.ejro.2022.100434. Fig. 2.
Imaging features of toxicities associated with immune checkpoint inhibitors

Original figure & article ↗ · CC BY 4.0 ↗

None. Original figure, unmodified; all published panels and annotations retained.

Used in: Checkpoint-related pneumonitis · Immune-mediated pneumonitis across checkpoint therapies

File provenance

Source: PubMed Central / U.S. National Library of Medicine. Retrieved 2026-10-28 Retrieved from the official PMC Open Access dataset. This stored copy may not include later source updates. No NLM endorsement.

SHA-256: 69f9b9f33886cbe5b9dd24e2ca29ca3a2dbe1d4b782bb071837565459549a396

Serial CT demonstrates evolving ground-glass change and subpleural fibrosis in one gemcitabine-exposed patient.
pattern example · Figure 2

Serial CT demonstrates evolving ground-glass change and subpleural fibrosis in one gemcitabine-exposed patient.

Original context: Gemcitabine for squamous-cell prostate cancer.

One patient over time. Used solely to illustrate treatment-related fibrotic injury, never as evidence for a different drug.

Zafar Bilal, Haque Tasmea, Tan Miranda et al.. Medicina (Kaunas). 2026 Mar 19;62(3):578. doi: 10.3390/medicina62030578. Figure 2.
Pulmonary Complications of Cancer Therapy: Clinical Presentations, Imaging Patterns, and Management Strategies

Original figure & article ↗ · CC BY 4.0 ↗

None. Original figure, unmodified; all published panels and annotations retained.

Used in: Delayed lung injury after busulfan · Carmustine-associated pulmonary fibrosis · Melphalan-associated pneumonitis / fibrosis · Bleomycin pneumonitis / fibrosis

File provenance

Source: PubMed Central / U.S. National Library of Medicine. Retrieved 2026-10-28 Retrieved from the official PMC Open Access dataset. This stored copy may not include later source updates. No NLM endorsement.

SHA-256: 229cca06f1a2c8c0d83f8b8180c38f35b88ecf02dce3e9f8f88f0c903f4e8476

Panel A shows bleomycin-related ground-glass change in Hodgkin lymphoma; other panels show different treatments.
pattern example · Figure 1

Panel A shows bleomycin-related ground-glass change in Hodgkin lymphoma; other panels show different treatments.

Original context: A: bleomycin/Hodgkin lymphoma. B: unnamed ICI/metastatic RCC. C: atezolizumab/thyroid cancer. D: T-DXd/colorectal cancer.

Only panel A is applicable to this card; preserve the uncropped original and show the other exposures in the label.

Zafar Bilal, Haque Tasmea, Tan Miranda et al.. Medicina (Kaunas). 2026 Mar 19;62(3):578. doi: 10.3390/medicina62030578. Figure 1.
Pulmonary Complications of Cancer Therapy: Clinical Presentations, Imaging Patterns, and Management Strategies

Original figure & article ↗ · CC BY 4.0 ↗

None. Original figure, unmodified; all published panels and annotations retained.

Used in: Bleomycin pneumonitis / fibrosis

File provenance

Source: PubMed Central / U.S. National Library of Medicine. Retrieved 2026-10-28 Retrieved from the official PMC Open Access dataset. This stored copy may not include later source updates. No NLM endorsement.

SHA-256: 28216cf8962c849bd985d4dce0923d4671f302f22714a2bf9fdcb6ed9df7e66f

HCT review: BOS with expiratory air trapping (A–B) and BOS with PPFE/fibrosis (D–F) in two distinct patients.
pattern example · Figure 4

HCT review: BOS with expiratory air trapping (A–B) and BOS with PPFE/fibrosis (D–F) in two distinct patients.

Original context: Figure caption: autologous HCT, 42-year-old woman (A–B); autologous HCT for MDS, 36-year-old woman (D–F). C is a different OP case.

Two BOS patients are counted; panel C is OP and excluded from the BOS count. The article's autologous/cGVHD terminology is internally unusual and needs owner clinical review.

Astashchanka Anna, Ryan Joseph, Lin Erica et al.. J Clin Med. 2021 Jul 22;10(15):3227. doi: 10.3390/jcm10153227. Figure 4.
Pulmonary Complications in Hematopoietic Stem Cell Transplant Recipients—A Clinician Primer

Original figure & article ↗ · CC BY 4.0 ↗

None. Original figure, unmodified; all published panels and annotations retained.

Used in: Bronchiolitis obliterans syndrome after allogeneic HCT

File provenance

Source: PubMed Central / U.S. National Library of Medicine. Retrieved 2026-10-28 Retrieved from the official PMC Open Access dataset. This stored copy may not include later source updates. No NLM endorsement.

SHA-256: b42bba224759b6d9f49caab268f2f48356e6d0aac9ff77cd70d8586e46281076

HCT review: angioinvasive Aspergillus (A), NTM with BOS (C–D), and Mucor (E); B is pneumococcal infection.
pattern example · Figure 5

HCT review: angioinvasive Aspergillus (A), NTM with BOS (C–D), and Mucor (E); B is pneumococcal infection.

Original context: Source captions: post-autologous HCT; 37-year-old woman with AML (A), 51-year-old woman with ALL (C–D), 49-year-old man (E).

Mixed diagnoses in one original figure. Only explicitly applicable patients count for each card.

Astashchanka Anna, Ryan Joseph, Lin Erica et al.. J Clin Med. 2021 Jul 22;10(15):3227. doi: 10.3390/jcm10153227. Figure 5.
Pulmonary Complications in Hematopoietic Stem Cell Transplant Recipients—A Clinician Primer

Original figure & article ↗ · CC BY 4.0 ↗

None. Original figure, unmodified; all published panels and annotations retained.

Used in: Bronchiolitis obliterans syndrome after allogeneic HCT · Pulmonary invasive mould infection in the transplant setting

File provenance

Source: PubMed Central / U.S. National Library of Medicine. Retrieved 2026-10-28 Retrieved from the official PMC Open Access dataset. This stored copy may not include later source updates. No NLM endorsement.

SHA-256: 9ae704933f73cc3534b1a7676631e77e6d03f6be4d90098c8027a9280413eccd

HRCT crazy-paving pattern in one reported IPS patient after marrow transplantation.
pattern example · Figure 1

HRCT crazy-paving pattern in one reported IPS patient after marrow transplantation.

Original context: Bone marrow transplantation; IPS diagnosis in the original case report.

One case. Crazy paving is nonspecific and cannot diagnose IPS or exclude infection.

Gasparetto Taisa Davaus, Marchiori Edson, Guimarães Marina B et al.. Cases J. 2008 Oct 13;1:234. doi: 10.1186/1757-1626-1-234. Figure 1.
Idiopathic pneumonia syndrome after bone marrow transplantation presenting with "crazy-paving" pattern on high-resolution computed tomography: a case report

Original figure & article ↗ · CC BY 2.0 ↗

None. Original figure, unmodified; all published panels and annotations retained.

Used in: Diffuse alveolar injury after HCT: consider IPS only after exclusions

File provenance

Source: PubMed Central / U.S. National Library of Medicine. Retrieved 2026-10-28 Retrieved from the official PMC Open Access dataset. This stored copy may not include later source updates. No NLM endorsement.

SHA-256: ede7049cb20bb5ad47c6e50f8f905d960df78f3da5e600a2d04da6646c1b0cf5

Panel A: lower-lobe consolidation in one reported IPS patient after HCT; B–C show a different PTLD patient.
pattern example · Figure 3

Panel A: lower-lobe consolidation in one reported IPS patient after HCT; B–C show a different PTLD patient.

Original context: Caption: 25-year-old man 89 days after autologous HCT for aplastic anemia (A). B–C are PTLD.

Only panel A counts as an IPS patient; other panels are a different disease.

Astashchanka Anna, Ryan Joseph, Lin Erica et al.. J Clin Med. 2021 Jul 22;10(15):3227. doi: 10.3390/jcm10153227. Figure 3.
Pulmonary Complications in Hematopoietic Stem Cell Transplant Recipients—A Clinician Primer

Original figure & article ↗ · CC BY 4.0 ↗

None. Original figure, unmodified; all published panels and annotations retained.

Used in: Diffuse alveolar injury after HCT: consider IPS only after exclusions

File provenance

Source: PubMed Central / U.S. National Library of Medicine. Retrieved 2026-10-28 Retrieved from the official PMC Open Access dataset. This stored copy may not include later source updates. No NLM endorsement.

SHA-256: 2c2bd162bf0c072c80aa58379228ef73eb579b14801fe98a8254b5533e3d1e91

Two patients with overlapping CT patterns: IPA in A–B, PJP in C–D; segmentation overlays are retained.
pattern example · Figure 2

Two patients with overlapping CT patterns: IPA in A–B, PJP in C–D; segmentation overlays are retained.

Original context: 55-year-old man with IPA (A–B); 36-year-old man with PJP (C–D). Patient-level oncologic drug exposure is not provided in the caption.

The figure illustrates CT overlap; neither diagnosis nor treatment causality follows from appearance alone.

Peng Zhiguo, Gao Xingzhe, He Miao et al.. Front Cell Infect Microbiol. 2025 Jul 10;15:1552556. doi: 10.3389/fcimb.2025.1552556. Figure 2.
Computed tomography-based radiomics prediction model for differentiating invasive pulmonary aspergillosis and Pneumocystis jirovecii pneumonia

Original figure & article ↗ · CC BY 4.0 ↗

None. Original figure, unmodified; all published panels and annotations retained.

Used in: Pneumocystis pneumonia during temozolomide therapy · Pulmonary invasive mould infection in the transplant setting

File provenance

Source: PubMed Central / U.S. National Library of Medicine. Retrieved 2026-10-28 Retrieved from the official PMC Open Access dataset. This stored copy may not include later source updates. No NLM endorsement.

SHA-256: 150bf2da55c781cee7d06d9726d3c374cecbf59f59a47db0b6ae87417e00ed21

Serial CT in one non-HIV PJP case with diffuse opacities and subsequent improvement.
pattern example · Fig. 1

Serial CT in one non-HIV PJP case with diffuse opacities and subsequent improvement.

Original context: 35-year-old man presenting with diabetic ketoacidosis; no temozolomide or oncologic exposure reported.

Pattern-only example outside oncology. Four serial panels are one patient. Source diagnosis depends on microbiology and clinical evidence.

Zhang Ying, Chen Anbao, Yang Chunyan et al.. Respir Med Case Rep. 2025 Sep 18;58:102289. doi: 10.1016/j.rmcr.2025.102289. Fig. 1.
Metagenomic next-generation sequencing assists in diagnosing Pneumocystis Jirovecii pneumonia in non-HIV patients: a case report

Original figure & article ↗ · CC BY 4.0 ↗

None. Original figure, unmodified; all published panels and annotations retained.

Used in: Pneumocystis pneumonia during temozolomide therapy

File provenance

Source: PubMed Central / U.S. National Library of Medicine. Retrieved 2026-10-28 Retrieved from the official PMC Open Access dataset. This stored copy may not include later source updates. No NLM endorsement.

SHA-256: 035cfafda0eb3748f177076d3a16255a10f732b861276028fbbe2507beefa9ae

Panel A is PJP in a woman with breast cancer; panel B is another patient with lymphangitic carcinoma.
pattern example · Fig. 2

Panel A is PJP in a woman with breast cancer; panel B is another patient with lymphangitic carcinoma.

Original context: A: 56-year-old woman with breast cancer, PJP; exact medication unspecified. B: 57-year-old woman with lymphangitic carcinoma.

Only panel A is applicable; the other panel is a malignant mimic.

Yamaguchi Ken, Egashira Ryoko, Nakazono Takahiko et al.. Breast Cancer. 2025 Dec 19;33(1):50–61. doi: 10.1007/s12282-025-01816-1. Fig. 2.
CT findings of lung injury during breast cancer treatment

Original figure & article ↗ · CC BY 4.0 ↗

None. Original figure, unmodified; all published panels and annotations retained.

Used in: Pneumocystis pneumonia during temozolomide therapy

File provenance

Source: PubMed Central / U.S. National Library of Medicine. Retrieved 2026-10-28 Retrieved from the official PMC Open Access dataset. This stored copy may not include later source updates. No NLM endorsement.

SHA-256: a6cc76e813587187655db72eda88976c9347865ffc2888bccb1033dd6d0c062b

Serial patchy pulmonary opacity during osimertinib, subsequently disappearing.
pattern example · FIGURE 3

Serial patchy pulmonary opacity during osimertinib, subsequently disappearing.

Original context: Osimertinib in EGFR-mutant NSCLC.

One serial case. Transience and absence of symptoms require clinical/serial correlation; CT alone cannot classify a new opacity as benign.

Mimura Chihiro, Kaneshiro Kazumi, Fujimoto Shodai et al.. Thorac Cancer. 2022 Dec 28;14(6):584–91. doi: 10.1111/1759-7714.14782. FIGURE 3.
TAPO in first‐line osimertinib therapy and continuation of osimertinib

Original figure & article ↗ · CC BY 4.0 ↗

None. Original figure, unmodified; all published panels and annotations retained.

Used in: Transient pulmonary opacities on osimertinib

File provenance

Source: PubMed Central / U.S. National Library of Medicine. Retrieved 2026-10-28 Retrieved from the official PMC Open Access dataset. This stored copy may not include later source updates. No NLM endorsement.

SHA-256: 54e0a1e85abca9d590795cf4fc2d8397e6f78a8f81fccce1fd29c95bfba5a5ca

Serial transient asymptomatic opacities in one tepotinib-exposed patient.
pattern example · FIGURE 2

Serial transient asymptomatic opacities in one tepotinib-exposed patient.

Original context: Tepotinib for MET exon-14-skipping NSCLC; not osimertinib.

Related TAPO morphology only. No osimertinib exposure in this patient.

Ikeo Satoshi, Yasuda Naoaki, Sakai Yuki et al.. Thorac Cancer. 2023 Feb 22;14(10):958–60. doi: 10.1111/1759-7714.14831. FIGURE 2.
Transient asymptomatic pulmonary opacities in a patient with MET exon 14 skipping non‐small cell lung cancer: A case report

Original figure & article ↗ · CC BY 4.0 ↗

None. Original figure, unmodified; all published panels and annotations retained.

Used in: Transient pulmonary opacities on osimertinib

File provenance

Source: PubMed Central / U.S. National Library of Medicine. Retrieved 2026-10-28 Retrieved from the official PMC Open Access dataset. This stored copy may not include later source updates. No NLM endorsement.

SHA-256: c04e5480a503a30e69b0562108bf0fcb2d51f686f223ec5e1522eadeb2df34a5

Echocardiography showing severe LV systolic dysfunction in one trastuzumab-exposed woman.
pattern example · Figure 2

Echocardiography showing severe LV systolic dysfunction in one trastuzumab-exposed woman.

Original context: Paclitaxel plus trastuzumab, breast radiotherapy, then trastuzumab maintenance; remote idarubicin/mitoxantrone leukemia therapy.

Single patient. Different cardiac phases are not independent cases. For other drugs this is a morphology-only LV dysfunction example.

Pan Qianjun, Zhao Rui, Graham-Hill Suzette. Cureus. 2024 Apr 27;16(4):e59172. doi: 10.7759/cureus.59172. Figure 2.
From 60% to 5% in 12 Weeks: A Trastuzumab-Induced Left Ventricular Ejection Fraction Drop

Original figure & article ↗ · CC BY 4.0 ↗

None. Original figure, unmodified; all published panels and annotations retained.

Used in: Cardiac dysfunction during carfilzomib · Doxorubicin-associated cardiomyopathy · Left ventricular dysfunction on trametinib · Sunitinib-associated LV dysfunction · Trastuzumab-associated cardiac dysfunction

File provenance

Source: PubMed Central / U.S. National Library of Medicine. Retrieved 2026-10-28 Retrieved from the official PMC Open Access dataset. This stored copy may not include later source updates. No NLM endorsement.

SHA-256: c1e4dfdb7519f455cfeb49922216f53a68c995ec2820d050d3dcc2d53fde613b

Echo demonstrates anterior wall-motion abnormality in one trastuzumab-associated ACS-like presentation.
pattern example · Figure 2

Echo demonstrates anterior wall-motion abnormality in one trastuzumab-associated ACS-like presentation.

Original context: FOLFOX (5-FU/leucovorin/oxaliplatin) plus trastuzumab for HER2-positive metastatic esophageal adenocarcinoma; prior cisplatin/5-FU/radiotherapy; 59-year-old man.

Diastolic and systolic images are one patient. Regional abnormality is nonspecific and requires coronary/clinical correlation.

Hidalgo Sylvana, Albright Carol A., Wells Gretchen L.. Case Rep Cardiol. 2013 Mar 6;2013:473979. doi: 10.1155/2013/473979. Figure 2.
A Case of Trastuzumab-Associated Cardiomyopathy Presenting as an Acute Coronary Syndrome: Acute Trastuzumab Cardiotoxicity

Original figure & article ↗ · CC BY 3.0 ↗

None. Original figure, unmodified; all published panels and annotations retained.

Used in: Cardiac dysfunction during carfilzomib · Doxorubicin-associated cardiomyopathy · Left ventricular dysfunction on trametinib · Sunitinib-associated LV dysfunction · Trastuzumab-associated cardiac dysfunction

File provenance

Source: PubMed Central / U.S. National Library of Medicine. Retrieved 2026-10-28 Retrieved from the official PMC Open Access dataset. This stored copy may not include later source updates. No NLM endorsement.

SHA-256: bb6e559049e463a0278c55ff75fdb5506dd79e1b6546b4491939e12bbb2cbd58

Serial CMR in a 68-year-old woman: ventricular enlargement, mapping and strain changes during combination treatment.
pattern example · FIGURE 3.

Serial CMR in a 68-year-old woman: ventricular enlargement, mapping and strain changes during combination treatment.

Original context: Taxane plus carboplatin plus trastuzumab plus pertuzumab (TCbHP); combination exposure, not trastuzumab monotherapy.

Serial images belong to one patient. CMR changes are related to the whole regimen; pattern-only on other drug cards.

Cheng Sainan, Deng Mei, Qi Linlin et al.. Radiol Oncol. 2025 Oct 27;59(4):510–21. doi: 10.2478/raon-2025-0043. FIGURE 3..
Cardiotoxicity in low-to-moderate cardiovascular risk patients undergoing anti-HER2 therapy: a prospective cardiac magnetic resonance study

Original figure & article ↗ · CC BY 4.0 ↗

None. Original figure, unmodified; all published panels and annotations retained.

Used in: Cardiac dysfunction during carfilzomib · Doxorubicin-associated cardiomyopathy · Left ventricular dysfunction on trametinib · Sunitinib-associated LV dysfunction · Trastuzumab-associated cardiac dysfunction

File provenance

Source: PubMed Central / U.S. National Library of Medicine. Retrieved 2026-10-28 Retrieved from the official PMC Open Access dataset. This stored copy may not include later source updates. No NLM endorsement.

SHA-256: e9f8020fc79e59656a8cb3780fe2cdb1e2207bacf4127f0dc2e095114981ddeb

CMR enhancement and pericardial/pleural fluid in one durvalumab-associated myocarditis case.
pattern example · Fig. 5

CMR enhancement and pericardial/pleural fluid in one durvalumab-associated myocarditis case.

Original context: Durvalumab for NSCLC; 67-year-old man.

Inflammatory myocardial-injury morphology; drug attribution requires the clinical context.

Gosangi Babina, McIntosh Lacey, Keraliya Abhishek et al.. Eur J Radiol Open. 2022 Aug 8;9:100434. doi: 10.1016/j.ejro.2022.100434. Fig. 5.
Imaging features of toxicities associated with immune checkpoint inhibitors

Original figure & article ↗ · CC BY 4.0 ↗

None. Original figure, unmodified; all published panels and annotations retained.

Used in: ICI myocarditis: a normal CMR does not exclude it · Cyclophosphamide-associated myocardial / pericardial injury

File provenance

Source: PubMed Central / U.S. National Library of Medicine. Retrieved 2026-10-28 Retrieved from the official PMC Open Access dataset. This stored copy may not include later source updates. No NLM endorsement.

SHA-256: 24e0ba2d014ee42d58f3c3a00ba46a063e7e8266ddc86340f1fb25d7668316f8

DOTATOC-PET/CT myocardial uptake in one suspected durvalumab myocarditis patient.
pattern example · Figure 5

DOTATOC-PET/CT myocardial uptake in one suspected durvalumab myocarditis patient.

Original context: Carboplatin/vinorelbine/radiotherapy followed by durvalumab; 61-year-old man with lung adenocarcinoma.

Investigational inflammation imaging in a clinically suspected case; uptake is not diagnostic alone. The figure also contains OP/tumour findings.

Berz Antonia M., Boughdad Sarah, Vietti-Violi Naïk et al.. Front Immunol. 2023 Feb 23;14:1133207. doi: 10.3389/fimmu.2023.1133207. Figure 5.
Imaging assessment of toxicity related to immune checkpoint inhibitors

Original figure & article ↗ · CC BY 4.0 ↗

None. Original figure, unmodified; all published panels and annotations retained.

Used in: ICI myocarditis: a normal CMR does not exclude it

File provenance

Source: PubMed Central / U.S. National Library of Medicine. Retrieved 2026-10-28 Retrieved from the official PMC Open Access dataset. This stored copy may not include later source updates. No NLM endorsement.

SHA-256: 798de441009178b773551d01a3718e7831889c73cbea89bd0ee56e586e09fd42

Serial echo and CMR show transient wall thickening, strain reduction and nonischemic enhancement after post-transplant cyclophosphamide.
pattern example · Figure 3

Serial echo and CMR show transient wall thickening, strain reduction and nonischemic enhancement after post-transplant cyclophosphamide.

Original context: Post-HCT cyclophosphamide with tacrolimus/abatacept for GVHD prophylaxis, 63-year-old man; thrombocytopenia may contribute.

All modalities and serial panels are one patient. Attribution is from the full case assessment, not imaging alone.

Jibawi Rivera Rade R., Harmon David M., Herrmann Joerg et al.. JACC Case Rep. 2026 Jan 21;31(8):106613. doi: 10.1016/j.jaccas.2025.106613. Figure 3.
Cyclophosphamide-Induced Hemorrhagic Myocarditis

Original figure & article ↗ · CC BY 4.0 ↗

None. Original figure, unmodified; all published panels and annotations retained.

Used in: Cyclophosphamide-associated myocardial / pericardial injury

File provenance

Source: PubMed Central / U.S. National Library of Medicine. Retrieved 2026-10-28 Retrieved from the official PMC Open Access dataset. This stored copy may not include later source updates. No NLM endorsement.

SHA-256: f44e4a29e278d80e743316bcd111204c7a222c756fcb0b2f019067ccd6385f51

TTE demonstrates apical hypokinesis during FOLFOX-associated Takotsubo cardiomyopathy.
pattern example · Figure 2

TTE demonstrates apical hypokinesis during FOLFOX-associated Takotsubo cardiomyopathy.

Original context: 5-FU plus leucovorin and oxaliplatin (FOLFOX).

Regimen-level exposure; TTE alone cannot establish 5-FU causality.

Sami Nabeel, Raizada Amit, Phillip Gabriella Jade et al.. Cureus. 2025 Apr 12;17(4):e82145. doi: 10.7759/cureus.82145. Figure 2.
Takotsubo Cardiomyopathy in a Patient Undergoing 5-Fluorouracil Infusion: Considerations for Folinic Acid, 5-Fluorouracil, and Oxaliplatin (FOLFOX) Cardiotoxicity and Rechallenge

Original figure & article ↗ · CC BY 4.0 ↗

None. Original figure, unmodified; all published panels and annotations retained.

Used in: Fluorouracil-associated cardiac injury

File provenance

Source: PubMed Central / U.S. National Library of Medicine. Retrieved 2026-10-28 Retrieved from the official PMC Open Access dataset. This stored copy may not include later source updates. No NLM endorsement.

SHA-256: 045d67726d7653414392779cc0cdf85e751aa159ee091236bd2b19f9b55ade3a

Echocardiogram shows a dilated dysfunctional apex and associated thrombus in a different patient.
pattern example · Figure 2

Echocardiogram shows a dilated dysfunctional apex and associated thrombus in a different patient.

Original context: Weekly 5-fluorouracil plus leucovorin after rectal-cancer surgery/radiotherapy; 66-year-old woman.

Original 5-FU combination context. Apical thrombus requires distinction from artifact.

Lim Stephanie Hui-Su, Wilson Sharon Mary, Hunter Arnagretta et al.. Case Rep Oncol Med. 2013 Dec 3;2013:206765. doi: 10.1155/2013/206765. Figure 2.
Takotsubo Cardiomyopathy and 5-Fluorouracil: Getting to the Heart of the Matter

Original figure & article ↗ · CC BY 3.0 ↗

None. Original figure, unmodified; all published panels and annotations retained.

Used in: Fluorouracil-associated cardiac injury

File provenance

Source: PubMed Central / U.S. National Library of Medicine. Retrieved 2026-10-28 Retrieved from the official PMC Open Access dataset. This stored copy may not include later source updates. No NLM endorsement.

SHA-256: ce9b9d0a8b59630b8694574f3e4879ba46270a2adc7168fe476e21176d633bca

Coronary angiography shows non-occlusive LAD disease in a third reported 5-FU-associated Takotsubo case.
pattern example · Figure 2

Coronary angiography shows non-occlusive LAD disease in a third reported 5-FU-associated Takotsubo case.

Original context: Continuous 5-fluorouracil after radiotherapy for anorectal cancer; 42-year-old woman.

Ancillary diagnostic imaging only: this angiogram does not depict cardiomyopathy, prove coronary spasm, or establish Takotsubo by itself.

Kumar Dilpat, Warsha FNU, Mehta Aditya et al.. Cureus. 2021 Mar 22;13(3):e14049. doi: 10.7759/cureus.14049. Figure 2.
5-Fluorouracil Induced Takotsubo Cardiomyopathy Complicated by Left Ventricular Thrombosis

Original figure & article ↗ · CC BY 3.0 ↗

None. Original figure, unmodified; all published panels and annotations retained.

Used in: Fluorouracil-associated cardiac injury

File provenance

Source: PubMed Central / U.S. National Library of Medicine. Retrieved 2026-10-28 Retrieved from the official PMC Open Access dataset. This stored copy may not include later source updates. No NLM endorsement.

SHA-256: 95ed9f97a42314c34c809878c4285a7a7ad40d22227d73c308140340e91ccfd9

Echo RV enlargement, pressure overload, strain and Doppler findings in scleroderma-associated PH.
pattern example · Figure 1

Echo RV enlargement, pressure overload, strain and Doppler findings in scleroderma-associated PH.

Original context: Scleroderma-associated severe pulmonary hypertension; no carfilzomib exposure.

PH/RV-overload pattern only. This patient does not supply evidence of carfilzomib causation. Etiologies differ and PH classification requires hemodynamic/clinical assessment.

Farrell Christine, Balasubramanian Aparna, Hays Allison G. et al.. Front Cardiovasc Med. 2022 Jan 18;8:794706. doi: 10.3389/fcvm.2021.794706. Figure 1.
A Clinical Approach to Multimodality Imaging in Pulmonary Hypertension

Original figure & article ↗ · CC BY 4.0 ↗

None. Original figure, unmodified; all published panels and annotations retained.

Used in: Pulmonary hypertension reported during carfilzomib

File provenance

Source: PubMed Central / U.S. National Library of Medicine. Retrieved 2026-10-28 Retrieved from the official PMC Open Access dataset. This stored copy may not include later source updates. No NLM endorsement.

SHA-256: e4318727a9a310d780e3ad19d1608ffcd4ab30c56c21ca58988aabc188691b43

PET/CT right-ventricular uptake and pulmonary-artery enlargement in emphysema-associated PH.
pattern example · Figure 3

PET/CT right-ventricular uptake and pulmonary-artery enlargement in emphysema-associated PH.

Original context: 52-year-old woman with emphysema-associated group 3 PH; corticosteroid exposure during exacerbation; no carfilzomib.

PH/RV-overload pattern only. This patient does not supply evidence of carfilzomib causation. Etiologies differ and PH classification requires hemodynamic/clinical assessment.

Farrell Christine, Balasubramanian Aparna, Hays Allison G. et al.. Front Cardiovasc Med. 2022 Jan 18;8:794706. doi: 10.3389/fcvm.2021.794706. Figure 3.
A Clinical Approach to Multimodality Imaging in Pulmonary Hypertension

Original figure & article ↗ · CC BY 4.0 ↗

None. Original figure, unmodified; all published panels and annotations retained.

Used in: Pulmonary hypertension reported during carfilzomib

File provenance

Source: PubMed Central / U.S. National Library of Medicine. Retrieved 2026-10-28 Retrieved from the official PMC Open Access dataset. This stored copy may not include later source updates. No NLM endorsement.

SHA-256: a7f3b17c8862c5261b5870fe17b7e5580b82fad4d32ef16d393e73010827840a

CMR RV dilation/hypertrophy, septal bowing and insertion-point enhancement in idiopathic PAH.
pattern example · Figure 5

CMR RV dilation/hypertrophy, septal bowing and insertion-point enhancement in idiopathic PAH.

Original context: 38-year-old woman with idiopathic PAH; no carfilzomib exposure.

PH/RV-overload pattern only. This patient does not supply evidence of carfilzomib causation. Etiologies differ and PH classification requires hemodynamic/clinical assessment.

Farrell Christine, Balasubramanian Aparna, Hays Allison G. et al.. Front Cardiovasc Med. 2022 Jan 18;8:794706. doi: 10.3389/fcvm.2021.794706. Figure 5.
A Clinical Approach to Multimodality Imaging in Pulmonary Hypertension

Original figure & article ↗ · CC BY 4.0 ↗

None. Original figure, unmodified; all published panels and annotations retained.

Used in: Pulmonary hypertension reported during carfilzomib

File provenance

Source: PubMed Central / U.S. National Library of Medicine. Retrieved 2026-10-28 Retrieved from the official PMC Open Access dataset. This stored copy may not include later source updates. No NLM endorsement.

SHA-256: 049451a73c5a79dde79cbe5ff95c857e2fe34a54dfcb4b8428db1f08836a2ed5

ADC abnormalities in bilateral centrum semiovale during a reported methotrexate stroke-like episode.
treatment example · Figure 1

ADC abnormalities in bilateral centrum semiovale during a reported methotrexate stroke-like episode.

Original context: 12-year-old boy with ALL; intrathecal methotrexate in a combination protocol.

Leitão Santos Mariana, Silva Sílvia, Moreira Amélia et al.. Cureus. 2023 Jun 5;15(6):e40004. doi: 10.7759/cureus.40004. Figure 1.
Methotrexate-Induced Stroke-Like Syndrome: A Typical Presentation of a Rare Complication

Original figure & article ↗ · CC BY 3.0 ↗

None. Original figure, unmodified; all published panels and annotations retained.

Used in: Methotrexate stroke-like neurotoxicity

File provenance

Source: PubMed Central / U.S. National Library of Medicine. Retrieved 2026-10-28 Retrieved from the official PMC Open Access dataset. This stored copy may not include later source updates. No NLM endorsement.

SHA-256: 7d1f94e234045a3b44b59340d8adf8a3c3bfa47d8162f5d049caffcdc3ff3366

DWI/ADC white-matter restriction with little early FLAIR change in a methotrexate-associated stroke mimic.
treatment example · Figure 1

DWI/ADC white-matter restriction with little early FLAIR change in a methotrexate-associated stroke mimic.

Original context: 18-year-old woman with ALL; intravenous and intrathecal methotrexate within consolidation therapy.

Benkirane Adam, Mulquin Nicolas, London Frédéric. J Belg Soc Radiol. 2022 Oct 31;106(1):98. doi: 10.5334/jbsr.2935. Figure 1.
Methotrexate-Induced Stroke-Like Encephalopathy: Beware the Stroke Mimic

Original figure & article ↗ · CC BY 4.0 ↗

None. Original figure, unmodified; all published panels and annotations retained.

Used in: Methotrexate stroke-like neurotoxicity

File provenance

Source: PubMed Central / U.S. National Library of Medicine. Retrieved 2026-10-28 Retrieved from the official PMC Open Access dataset. This stored copy may not include later source updates. No NLM endorsement.

SHA-256: d9256bf28cb7e08ab8ac6a5e6b5a05308eb88ada5a45dfbfde16d7a2b515abdc

Callosal diffusion restriction and subsequent improvement in a reported fluorouracil neurotoxicity case.
treatment example · Figure 1

Callosal diffusion restriction and subsequent improvement in a reported fluorouracil neurotoxicity case.

Original context: Fluorouracil-containing chemotherapy; normal measured DPD activity in this case.

Natarajan Ulaganathan, Onyechi Afoma, Ohemeng-Dapaah Jessica. Cureus. 2023 Dec 4;15(12):e49898. doi: 10.7759/cureus.49898. Figure 1.
5-Fluorouracil Neurotoxicity in a Patient With Normal Dihydropyrimidine Dehydrogenase Activity

Original figure & article ↗ · CC BY 4.0 ↗

None. Original figure, unmodified; all published panels and annotations retained.

Used in: 5-FU encephalopathy / leukoencephalopathy · Capecitabine-associated leukoencephalopathy · Delayed fludarabine neurotoxicity · Leukoencephalopathy reported during blinatumomab

File provenance

Source: PubMed Central / U.S. National Library of Medicine. Retrieved 2026-10-28 Retrieved from the official PMC Open Access dataset. This stored copy may not include later source updates. No NLM endorsement.

SHA-256: 58002d1c836dff000819a2674f7deb4ad1b3303d45db88bd474095e98ea82ed8

FLAIR and diffusion white-matter abnormalities following fluorouracil exposure in a patient with seizures and altered mental status.
treatment example · Figure 1

FLAIR and diffusion white-matter abnormalities following fluorouracil exposure in a patient with seizures and altered mental status.

Original context: 54-year-old woman with cecal adenocarcinoma after fluorouracil-containing treatment; hypertension was also present.

El Aissaouy Mohammed, Douqchi Badie, El Aidouni Ghizlane et al.. Cureus. 2023 May 23;15(5):e39364. doi: 10.7759/cureus.39364. Figure 1.
Chemotherapy-Induced Leukoencephalopathy Revealed by Seizure and Alteration of the Mental Status

Original figure & article ↗ · CC BY 3.0 ↗

None. Original figure, unmodified; all published panels and annotations retained.

Used in: 5-FU encephalopathy / leukoencephalopathy

File provenance

Source: PubMed Central / U.S. National Library of Medicine. Retrieved 2026-10-28 Retrieved from the official PMC Open Access dataset. This stored copy may not include later source updates. No NLM endorsement.

SHA-256: bb077e0ae88e0dd700e1a98d6a340e3d2737c5758a46fdb004858af9db0660ec

T2, DWI and ADC white-matter and callosal changes in a reported capecitabine leukoencephalopathy case.
treatment example · Figure 1

T2, DWI and ADC white-matter and callosal changes in a reported capecitabine leukoencephalopathy case.

Original context: 40-year-old man receiving capecitabine plus oxaliplatin for duodenal carcinoma.

Waheed Midhat, Yasmeen Ammara, Malik Farzan et al.. Cureus. 2025 Jun 11;17(6):e85756. doi: 10.7759/cureus.85756. Figure 1.
Capecitabine-Induced Leukoencephalopathy: A Case Report

Original figure & article ↗ · CC BY 4.0 ↗

None. Original figure, unmodified; all published panels and annotations retained.

Used in: Capecitabine-associated leukoencephalopathy · Delayed fludarabine neurotoxicity · Leukoencephalopathy reported during blinatumomab

File provenance

Source: PubMed Central / U.S. National Library of Medicine. Retrieved 2026-10-28 Retrieved from the official PMC Open Access dataset. This stored copy may not include later source updates. No NLM endorsement.

SHA-256: 2d7e19a968c58819759356e74a6e9d186d035d193312b00eba1c92386b5b0434

Multifocal T2/FLAIR lesions and increased ADC in a reported chemotherapy-associated leukoencephalopathy case.
treatment example · Figure 1

Multifocal T2/FLAIR lesions and increased ADC in a reported chemotherapy-associated leukoencephalopathy case.

Original context: Capecitabine, oxaliplatin and bevacizumab in a 50-year-old woman; vasogenic edema phenotype and co-exposures limit individual-drug attribution.

Bougea Anastasia, Voskou Panagiota, Kilidireas Constantinos et al.. Case Rep Oncol Med. 2016 Feb 7;2016:2408269. doi: 10.1155/2016/2408269. Figure 1.
Capecitabine Induced Multifocal Leukoencephalopathy: Do We Have Always to Switch off the Chemotherapy?

Original figure & article ↗ · CC BY 4.0 ↗

None. Original figure, unmodified; all published panels and annotations retained.

Used in: Capecitabine-associated leukoencephalopathy

File provenance

Source: PubMed Central / U.S. National Library of Medicine. Retrieved 2026-10-28 Retrieved from the official PMC Open Access dataset. This stored copy may not include later source updates. No NLM endorsement.

SHA-256: 06da165f89835be4905b4ee2cdf52a8b26138df6b62e52cc6234ab3452a45dc0

Brain MRI shows enhancing nodular lesions with surrounding edema and peripheral diffusion restriction in a systemic aspergillosis case.
treatment example · Figure 2

Brain MRI shows enhancing nodular lesions with surrounding edema and peripheral diffusion restriction in a systemic aspergillosis case.

Original context: Ibrutinib-treated DLBCL patient with venetoclax recently added; multiple prior therapies.

Co-exposures and underlying lymphoma preclude isolated ibrutinib causality.

Pehlivan Umur Anil, Onan Hasan Bilen, Bayram Ertugrul et al.. Cureus. 2021 Nov 26;13(11):e19911. doi: 10.7759/cureus.19911. Figure 2.
Systemic Aspergillosis: Radiological Findings in a Case With Diffuse Large B Cell Lymphoma Treated by Ibrutinib

Original figure & article ↗ · CC BY 3.0 ↗

None. Original figure, unmodified; all published panels and annotations retained.

Used in: CNS fungal infection during ibrutinib exposure

File provenance

Source: PubMed Central / U.S. National Library of Medicine. Retrieved 2026-10-28 Retrieved from the official PMC Open Access dataset. This stored copy may not include later source updates. No NLM endorsement.

SHA-256: 73b19db180e5c07bfae20f04fd4163ae97dd1ecaa215465f78f4c1a36778b44f

Contrast MRI shows a dominant right frontal ring-enhancing mass and smaller left occipital focus in tissue-confirmed cerebral aspergillosis.
treatment example · Figure 1

Contrast MRI shows a dominant right frontal ring-enhancing mass and smaller left occipital focus in tissue-confirmed cerebral aspergillosis.

Original context: 68-year-old man with CLL during ibrutinib exposure.

Tompler Konstantinos Iason, Osthoff Michael. Cureus. 2026 Sep 4;18(9):e115796. doi: 10.7759/cureus.115796. Figure 1.
Cerebral Aspergillosis in a Patient on Ibrutinib: A Case of Diagnostic Ambiguity and Multidisciplinary Care

Original figure & article ↗ · CC BY 4.0 ↗

None. Original figure, unmodified; all published panels and annotations retained.

Used in: CNS fungal infection during ibrutinib exposure

File provenance

Source: PubMed Central / U.S. National Library of Medicine. Retrieved 2026-10-28 Retrieved from the official PMC Open Access dataset. This stored copy may not include later source updates. No NLM endorsement.

SHA-256: cc8f434f96d4464d797d7a0c358fd9e55c5d0ae07c59711f0f46da3162e83515

MR venography shows absent superior sagittal sinus flow in a child receiving PEG-asparaginase within ALL induction.
treatment example · Figure 4

MR venography shows absent superior sagittal sinus flow in a child receiving PEG-asparaginase within ALL induction.

Original context: 9-year-old boy; PEG-conjugated E. coli asparaginase plus other induction drugs.

Alsaid Youssef, Gulab Shamshad, Bayoumi Mohammed et al.. Case Rep Hematol. 2013 May 28;2013:841057. doi: 10.1155/2013/841057. Figure 4.
Cerebral Sinus Venous Thrombosis due to Asparaginase Therapy

Original figure & article ↗ · CC BY 3.0 ↗

None. Original figure, unmodified; all published panels and annotations retained.

Used in: Cerebral venous thrombosis with pegaspargase

File provenance

Source: PubMed Central / U.S. National Library of Medicine. Retrieved 2026-10-28 Retrieved from the official PMC Open Access dataset. This stored copy may not include later source updates. No NLM endorsement.

SHA-256: 57ab94cd91841dcfe29850da54f79d34e33e1b3db4bc83206642c59de591b2f1

Sagittal CT angiographic reconstruction identifies superior sagittal sinus thrombosis in a pegaspargase-containing induction case.
treatment example · Figure 5

Sagittal CT angiographic reconstruction identifies superior sagittal sinus thrombosis in a pegaspargase-containing induction case.

Original context: 34-year-old man receiving C10403 induction with pegaspargase, vincristine, daunorubicin and prednisone.

Torere Beatrice E, Weigold Joseph, Aiwuyo Henry O et al.. Cureus. 2023 Apr 12;15(4):e37482. doi: 10.7759/cureus.37482. Figure 5.
Diagnostic and Therapeutic Challenges of Concurrent Intracranial Hemorrhage and Cerebral Venous Thrombosis in a Patient With Acute Lymphoblastic Leukemia: A Case Report and Literature Review

Original figure & article ↗ · CC BY 3.0 ↗

None. Original figure, unmodified; all published panels and annotations retained.

Used in: Cerebral venous thrombosis with pegaspargase

File provenance

Source: PubMed Central / U.S. National Library of Medicine. Retrieved 2026-10-28 Retrieved from the official PMC Open Access dataset. This stored copy may not include later source updates. No NLM endorsement.

SHA-256: fbf891957d027230d0c6b0ddb477547f3314e47b50a14c466487a8358c1b7d23

MRI shows deep venous infarcts in a published cerebral venous thrombosis case. Pattern example from another clinical context.
pattern example · Figure 1

MRI shows deep venous infarcts in a published cerebral venous thrombosis case. Pattern example from another clinical context.

Original context: 25-year-old woman with Smith–Magenis syndrome and proctocolitis; no cancer therapy or asparaginase exposure.

Same CVT/venous-infarction syndrome; no pegaspargase exposure.

Zahoor Hovra, Hamza Ameer, Aigbe Eboselumen et al.. Cureus. 2023 Jul 16;15(7):e41970. doi: 10.7759/cureus.41970. Figure 1.
Cerebral Venous Thrombosis in Young Adults: Unknown Origins

Original figure & article ↗ · CC BY 3.0 ↗

None. Original figure, unmodified; all published panels and annotations retained.

Used in: Cerebral venous thrombosis with pegaspargase

File provenance

Source: PubMed Central / U.S. National Library of Medicine. Retrieved 2026-10-28 Retrieved from the official PMC Open Access dataset. This stored copy may not include later source updates. No NLM endorsement.

SHA-256: a46292e167c85b9688818b95d6473d1155c68842c5aa1adf18cc1ad3f14f663e

Posterior-fossa MRI abnormalities in a reported rituximab-exposed PML case, including diffusion and enhancement changes.
treatment example · Figure 2

Posterior-fossa MRI abnormalities in a reported rituximab-exposed PML case, including diffusion and enhancement changes.

Original context: 79-year-old woman with rheumatoid arthritis treated with rituximab; non-oncology exposure context.

Guduru Mounika, Bendi Venkata Sunil, Bebawy Mariana S et al.. Cureus. 2020 Oct 10;12(10):e10888. doi: 10.7759/cureus.10888. Figure 2.
Posterior Fossa Progressive Multifocal Leukoencephalopathy Secondary to Rituximab

Original figure & article ↗ · CC BY 3.0 ↗

None. Original figure, unmodified; all published panels and annotations retained.

Used in: PML in a rituximab-exposed patient

File provenance

Source: PubMed Central / U.S. National Library of Medicine. Retrieved 2026-10-28 Retrieved from the official PMC Open Access dataset. This stored copy may not include later source updates. No NLM endorsement.

SHA-256: a59994c9f6fdfec28cd6a78aac5ce3b4ba399a5d3c33413c9e5f5f367049ce82

Multisequence MRI in biopsy-confirmed PML after extensive lymphoma therapy and autologous transplantation.
treatment example · Figure 1

Multisequence MRI in biopsy-confirmed PML after extensive lymphoma therapy and autologous transplantation.

Original context: 29-year-old man with Hodgkin lymphoma after rituximab-containing R-ICE and rituximab-bendamustine, then BEAM/autologous HCT.

Multiple prior immune-suppressing exposures; no isolated rituximab causality.

Rehman Ibad, Ali Zafar, Rasheed Sana et al.. Cureus. 2023 Jan 7;15(1):e33473. doi: 10.7759/cureus.33473. Figure 1.
Progressive Multifocal Leukoencephalopathy in a Patient With Classic Hodgkin’s Lymphoma Post-Bone Marrow Transplant: A Case Report

Original figure & article ↗ · CC BY 3.0 ↗

None. Original figure, unmodified; all published panels and annotations retained.

Used in: PML in a rituximab-exposed patient

File provenance

Source: PubMed Central / U.S. National Library of Medicine. Retrieved 2026-10-28 Retrieved from the official PMC Open Access dataset. This stored copy may not include later source updates. No NLM endorsement.

SHA-256: 732874402863d6be9cc1516234756beced11086824c2b8814364a940bf7414a2

Multifocal FLAIR and punctate enhancement abnormalities in a PML case associated with relapsed lymphoma.
pattern example · Figure 1

Multifocal FLAIR and punctate enhancement abnormalities in a PML case associated with relapsed lymphoma.

Original context: Prior lymphoma cytotoxic treatment; not receiving rituximab maintenance. Pattern example without verified rituximab exposure.

PML pattern only; this is not rituximab-specific evidence.

Chen Shi, Nan Haitian, Li Junjie. Front Oncol. 2026 Feb 18;16:1710057. doi: 10.3389/fonc.2026.1710057. Figure 1.
Progressive multifocal leukoencephalopathy as the initial manifestation of relapsed lymphoma: a case report

Original figure & article ↗ · CC BY 4.0 ↗

None. Original figure, unmodified; all published panels and annotations retained.

Used in: PML in a rituximab-exposed patient

File provenance

Source: PubMed Central / U.S. National Library of Medicine. Retrieved 2026-10-28 Retrieved from the official PMC Open Access dataset. This stored copy may not include later source updates. No NLM endorsement.

SHA-256: 44cb0f052363e79c945fe4ac8acbfb0a2d4506f619de78b57a53e1f5d6f98a42

MRI examples in five distinct cyclosporine-exposed pediatric HCT recipients; the full composite also contains EEG.
treatment example · Fig. 1

MRI examples in five distinct cyclosporine-exposed pediatric HCT recipients; the full composite also contains EEG.

Original context: Cyclosporine after pediatric haploidentical HSCT; source patients 1, 6, 4, 2 and 3.

a–c patient 1; d–e patient 6; f patient 4; g–i patient 2; j–k patient 3. MRI and EEG are mixed; EEG does not add an imaging case.

Wang Yong, Zheng Yongzhi, Wen Jingjing et al.. Ital J Pediatr. 2021 Apr 1;47:83. doi: 10.1186/s13052-021-01037-0. Fig. 1.
Cyclosporine A-related neurotoxicity after haploidentical hematopoietic stem cell transplantation in children with hematopathy

Original figure & article ↗ · CC BY 4.0 ↗

None. Original figure, unmodified; all published panels and annotations retained.

Used in: Cyclosporine-associated PRES in transplant recipients · PRES during bevacizumab therapy · PRES during pazopanib treatment · PRES reported with enzalutamide · Tacrolimus-associated PRES after transplantation · PRES reported during bortezomib

File provenance

Source: PubMed Central / U.S. National Library of Medicine. Retrieved 2026-10-28 Retrieved from the official PMC Open Access dataset. This stored copy may not include later source updates. No NLM endorsement.

SHA-256: 5e522d00ad0d72e1b584b8a04cd4f57254cac6b8e750f136264418cd396c8c66

Posterior-predominant cortical FLAIR hyperintensities in a reported bevacizumab-associated PRES case.
treatment example · Figure 1

Posterior-predominant cortical FLAIR hyperintensities in a reported bevacizumab-associated PRES case.

Original context: 72-year-old man with lung adenocarcinoma; bevacizumab maintenance after carboplatin/paclitaxel/bevacizumab.

Lazarus Mark, Amundson Stanley, Belani Rajesh. Case Rep Oncol Med. 2012 Nov 29;2012:819546. doi: 10.1155/2012/819546. Figure 1.
An Association between Bevacizumab and Recurrent Posterior Reversible Encephalopathy Syndrome in a Patient Presenting with Deep Vein Thrombosis: A Case Report and Review of the Literature

Original figure & article ↗ · CC BY 3.0 ↗

None. Original figure, unmodified; all published panels and annotations retained.

Used in: PRES during bevacizumab therapy · Cyclosporine-associated PRES in transplant recipients · PRES during pazopanib treatment · PRES reported with enzalutamide · Tacrolimus-associated PRES after transplantation

File provenance

Source: PubMed Central / U.S. National Library of Medicine. Retrieved 2026-10-28 Retrieved from the official PMC Open Access dataset. This stored copy may not include later source updates. No NLM endorsement.

SHA-256: d8c0c746e102b13c560763dd87af29b1db5656c2c24e802e85becb70497c2893

FLAIR/DWI at PRES onset and follow-up in one pazopanib-exposed patient.
treatment example · Fig. 1

FLAIR/DWI at PRES onset and follow-up in one pazopanib-exposed patient.

Original context: 49-year-old woman with soft-tissue sarcoma receiving pazopanib; severe hypertension developed with the episode.

Deguchi Shoichi, Mitsuya Koichi, Nakasu Yoko et al.. Invest New Drugs. 2017 Oct 25;36(2):346–9. doi: 10.1007/s10637-017-0521-5. Fig. 1.
Posterior reversible encephalopathy syndrome (PRES) induced by pazopanib, a multi-targeting tyrosine kinase inhibitor, in a patient with soft-tissue sarcoma: case report and review of the literature

Original figure & article ↗ · CC BY 4.0 ↗

None. Original figure, unmodified; all published panels and annotations retained.

Used in: PRES during pazopanib treatment · Cyclosporine-associated PRES in transplant recipients · PRES during bevacizumab therapy · PRES reported with enzalutamide · Tacrolimus-associated PRES after transplantation

File provenance

Source: PubMed Central / U.S. National Library of Medicine. Retrieved 2026-10-28 Retrieved from the official PMC Open Access dataset. This stored copy may not include later source updates. No NLM endorsement.

SHA-256: df20e89f36947f4eec6a1b2fdc30e36e72148f40c691004d798e172586e77ed1

Hemorrhagic PRES on MRI/CT in a tacrolimus-exposed renal-transplant recipient.
pattern example · Figure 6

Hemorrhagic PRES on MRI/CT in a tacrolimus-exposed renal-transplant recipient.

Original context: 36-year-old man after renal transplantation on tacrolimus; no HSCT.

Exact drug, different transplant setting. Preserve the renal-transplant exposure label; it does not establish HSCT-specific imaging.

Paladi Bhargavi, Yarlagadda Jyotsna, Chetana Naga Sai Tarani et al.. Cureus. 2024 Oct 26;16(10):e72431. doi: 10.7759/cureus.72431. Figure 6.
Posterior Reversible Encephalopathy Syndrome: A Clinico-Radiological Approach

Original figure & article ↗ · CC BY 4.0 ↗

None. Original figure, unmodified; all published panels and annotations retained.

Used in: Tacrolimus-associated PRES after transplantation · Cyclosporine-associated PRES in transplant recipients · PRES during bevacizumab therapy · PRES during pazopanib treatment · PRES reported with enzalutamide

File provenance

Source: PubMed Central / U.S. National Library of Medicine. Retrieved 2026-10-28 Retrieved from the official PMC Open Access dataset. This stored copy may not include later source updates. No NLM endorsement.

SHA-256: fc3062533451b74bd52faaf822a4ea7d5298d1a0b807874fd675b10095ed0913

Axial FLAIR MRI without an acute abnormality in a reported pembrolizumab-related encephalitis case.
treatment example · Figure 1

Axial FLAIR MRI without an acute abnormality in a reported pembrolizumab-related encephalitis case.

Original context: 63-year-old woman with triple-negative breast cancer; pembrolizumab with paclitaxel/carboplatin.

An example of clinical encephalitis with normal MRI, not a positive imaging sign.

Obaid Dalal A, Jatan Noora, Alawadhi Khawla Y et al.. Cureus. 2026 Jan 22;18(1):e102112. doi: 10.7759/cureus.102112. Figure 1.
Pembrolizumab-Induced Autoimmune Encephalitis: A Rare Case

Original figure & article ↗ · CC BY 4.0 ↗

None. Original figure, unmodified; all published panels and annotations retained.

Used in: Checkpoint-associated encephalitis

File provenance

Source: PubMed Central / U.S. National Library of Medicine. Retrieved 2026-10-28 Retrieved from the official PMC Open Access dataset. This stored copy may not include later source updates. No NLM endorsement.

SHA-256: af0d6de78135cbc06fe21b6657e8831cb6ccda8dfec58b2d3059b0e7bb0243e8

Serial brain MRI in severe ICANS after axicabtagene ciloleucel, with cortical/pontine signal change and leptomeningeal enhancement.
treatment example · Figure 3

Serial brain MRI in severe ICANS after axicabtagene ciloleucel, with cortical/pontine signal change and leptomeningeal enhancement.

Original context: Axicabtagene ciloleucel (Yescarta) after fludarabine/cyclophosphamide lymphodepletion; the patient later developed GBS-like myeloneuropathy.

Only the brain ICANS panels are selected; subsequent GBS spinal findings are a separate syndrome.

Kilroe Kathleen M., Clarke Jamie E., Ann Phoebe et al.. Front Neurol. 2025 Nov 13;16:1704826. doi: 10.3389/fneur.2025.1704826. Figure 3.
Guillain-Barre syndrome in patients receiving chimeric antigen receptor T-cell therapy: an individual participant data meta-analysis

Original figure & article ↗ · CC BY 4.0 ↗

None. Original figure, unmodified; all published panels and annotations retained.

Used in: ICANS after CAR-T: a normal MRI does not exclude it · Elranatamab-associated ICANS · Glofitamab-associated neurological toxicity / ICANS · ICANS after ciltacabtagene autoleucel · Neurological toxicity after idecabtagene vicleucel · Neurological toxicity after lisocabtagene maraleucel · Tarlatamab-associated ICANS in lung-cancer therapy · Teclistamab-associated neurological toxicity / ICANS

File provenance

Source: PubMed Central / U.S. National Library of Medicine. Retrieved 2026-10-28 Retrieved from the official PMC Open Access dataset. This stored copy may not include later source updates. No NLM endorsement.

SHA-256: 2885389ca7f21fb377cf0e909168356afe34dbb06ea64628f1cf39548f9e9ac4

MRI in clinical ICANS is largely unrevealing; the source describes only a possible left mesial-temporal signal abnormality.
treatment example · Figure 2

MRI in clinical ICANS is largely unrevealing; the source describes only a possible left mesial-temporal signal abnormality.

Original context: CAR-T treatment for DLBCL; product not specified in the checked case.

The mesial-temporal interpretation was controversial in the original report. Do not label as definite encephalitis or edema.

Yorichika Yasufumi, Neshige Shuichiro, Edahiro Taro et al.. Cureus. 2024 Mar 30;16(3):e57298. doi: 10.7759/cureus.57298. Figure 2.
An Early Neurological Indicator of Immune Effector Cell-Associated Neurotoxicity Syndrome

Original figure & article ↗ · CC BY 4.0 ↗

None. Original figure, unmodified; all published panels and annotations retained.

Used in: ICANS after CAR-T: a normal MRI does not exclude it · Elranatamab-associated ICANS · Glofitamab-associated neurological toxicity / ICANS · ICANS after ciltacabtagene autoleucel · Neurological toxicity after idecabtagene vicleucel · Neurological toxicity after lisocabtagene maraleucel · Tarlatamab-associated ICANS in lung-cancer therapy · Teclistamab-associated neurological toxicity / ICANS

File provenance

Source: PubMed Central / U.S. National Library of Medicine. Retrieved 2026-10-28 Retrieved from the official PMC Open Access dataset. This stored copy may not include later source updates. No NLM endorsement.

SHA-256: 39f192ed8629e4330bea806f5e5a171d572bf82534fa05a056bb58a0f5117702

MRI white-matter, splenial and deep-gray findings in a reported talquetamab-associated ICANS case.
pattern example · Figure 1

MRI white-matter, splenial and deep-gray findings in a reported talquetamab-associated ICANS case.

Original context: Talquetamab for multiple myeloma. Despite CAR-T language elsewhere in the paper, the case treatment is a bispecific antibody.

ICANS syndrome example from talquetamab; not a CAR-T product case and not evidence of another drug association.

Marino Mark D, Mader John P, Kardasis William et al.. Cureus. 2025 May 19;17(5):e84407. doi: 10.7759/cureus.84407. Figure 1.
Evolving Magnetic Resonance Imaging (MRI) Findings in Immune Effector Cell-Associated Neurotoxicity Syndrome

Original figure & article ↗ · CC BY 4.0 ↗

None. Original figure, unmodified; all published panels and annotations retained.

Used in: ICANS after CAR-T: a normal MRI does not exclude it · Elranatamab-associated ICANS · Glofitamab-associated neurological toxicity / ICANS · ICANS after ciltacabtagene autoleucel · Neurological toxicity after idecabtagene vicleucel · Neurological toxicity after lisocabtagene maraleucel · Tarlatamab-associated ICANS in lung-cancer therapy · Teclistamab-associated neurological toxicity / ICANS

File provenance

Source: PubMed Central / U.S. National Library of Medicine. Retrieved 2026-10-28 Retrieved from the official PMC Open Access dataset. This stored copy may not include later source updates. No NLM endorsement.

SHA-256: 4e5db91028137fbc04a06bb10dcbc0272bf301129000c5ec8081ebd5295e861e

MRI during elranatamab-associated clinical ICANS shows an old thalamic hemorrhagic residue, without a new explanatory lesion.
treatment example · Figure 4

MRI during elranatamab-associated clinical ICANS shows an old thalamic hemorrhagic residue, without a new explanatory lesion.

Original context: Elranatamab for myeloma; pre-existing left thalamic hemorrhage.

The marked hemosiderin is chronic and not an ICANS lesion. This illustrates the role of imaging in checking alternatives.

Kikuchi Taku, Kunisada Kodai, Sato Kota et al.. Cureus. 2024 Dec 1;16(12):e74902. doi: 10.7759/cureus.74902. Figure 4.
Severe Immune Effector Cell-Associated Neurotoxicity Syndrome in a Patient With Multiple Myeloma Treated With Elranatamab

Original figure & article ↗ · CC BY 4.0 ↗

None. Original figure, unmodified; all published panels and annotations retained.

Used in: Elranatamab-associated ICANS

File provenance

Source: PubMed Central / U.S. National Library of Medicine. Retrieved 2026-10-28 Retrieved from the official PMC Open Access dataset. This stored copy may not include later source updates. No NLM endorsement.

SHA-256: facd869de006afc2f30730de6d4116e579bcbaef2dc7b15ef1558d1bee533fda

Cerebellar-predominant FLAIR and diffusion abnormalities in an unusual cytarabine-associated cerebellar encephalitis case.
treatment example · Figure 1

Cerebellar-predominant FLAIR and diffusion abnormalities in an unusual cytarabine-associated cerebellar encephalitis case.

Original context: 57-year-old woman with AML; cytarabine plus daunorubicin and worsening renal function.

A positive-MRI exception; typical clinical cerebellar toxicity may have no explanatory MRI lesion. Dose terminology follows the original report and is not generalized.

Lenfant Christine, Greiner Nathalie, Duprez Thierry. J Belg Soc Radiol. 2021 Sep 16;105(1):46. doi: 10.5334/jbsr.2492. Figure 1.
Cytarabine-Induced Encephalitis

Original figure & article ↗ · CC BY 4.0 ↗

None. Original figure, unmodified; all published panels and annotations retained.

Used in: High-dose cytarabine cerebellar toxicity

File provenance

Source: PubMed Central / U.S. National Library of Medicine. Retrieved 2026-10-28 Retrieved from the official PMC Open Access dataset. This stored copy may not include later source updates. No NLM endorsement.

SHA-256: 7eb9e6c0c143c6da55a2fb80396227c04c978c650631c569be4cb885520c33e3

Postcontrast coronal MRI shows pituitary and stalk enlargement/enhancement in an ICI-associated hypophysitis case.
treatment example · Figure 1

Postcontrast coronal MRI shows pituitary and stalk enlargement/enhancement in an ICI-associated hypophysitis case.

Original context: 60-year-old woman with renal-cell carcinoma receiving nivolumab plus ipilimumab.

Yossef Kristena, Naidoo Shiva F, Lai William et al.. Cureus. 2022 Apr 19;14(4):e24291. doi: 10.7759/cureus.24291. Figure 1.
Early Detection of Immune-Mediated Hypophysitis With Use of Checkpoint Inhibitor Immunotherapy

Original figure & article ↗ · CC BY 3.0 ↗

None. Original figure, unmodified; all published panels and annotations retained.

Used in: Checkpoint-associated hypophysitis

File provenance

Source: PubMed Central / U.S. National Library of Medicine. Retrieved 2026-10-28 Retrieved from the official PMC Open Access dataset. This stored copy may not include later source updates. No NLM endorsement.

SHA-256: 72f24b60f3343e69249b0cf9dfcda75aeeffd31d69c3511054efc720e67fa688

Pituitary protocol MRI in a reported pembrolizumab-related hypophysitis case.
treatment example · Figure 1

Pituitary protocol MRI in a reported pembrolizumab-related hypophysitis case.

Original context: 68-year-old woman with lung adenocarcinoma receiving pemetrexed, carboplatin and pembrolizumab.

The source labels T2 panels A/C as normal-appearing and postcontrast panels B/D as showing enlargement/enhancement. The timing relationship is not independently clear; do not label baseline/follow-up or assert that all four panels are from the same examination. The article presents one patient, so count one case.

Alasmar Abdalrahman, San Su Su, Ta Thu et al.. Cureus. 2026 Apr 26;18(4):e107752. doi: 10.7759/cureus.107752. Figure 1.
Central Diabetes Insipidus Following Steroid Replacement for Hypoadrenalism in Pembrolizumab-Induced Hypophysitis

Original figure & article ↗ · CC BY 4.0 ↗

None. Original figure, unmodified; all published panels and annotations retained.

Used in: Checkpoint-associated hypophysitis

File provenance

Source: PubMed Central / U.S. National Library of Medicine. Retrieved 2026-10-28 Retrieved from the official PMC Open Access dataset. This stored copy may not include later source updates. No NLM endorsement.

SHA-256: 84e2030f610b018534c29e9131921def6359be082bb667472f9c5423ba7c0e1a

OCT shows intra/subretinal fluid and outer-retinal changes during a reported MEK retinopathy episode.
treatment example · Fig. 3

OCT shows intra/subretinal fluid and outer-retinal changes during a reported MEK retinopathy episode.

Original context: 71-year-old man receiving dabrafenib plus trametinib for metastatic melanoma.

Tyagi Pallavi, Santiago Cynthia. BMC Ophthalmol. 2018 Sep 14;18(Suppl 1):221. doi: 10.1186/s12886-018-0861-8. Fig. 3.
New features in MEK retinopathy

Original figure & article ↗ · CC BY 4.0 ↗

None. Original figure, unmodified; all published panels and annotations retained.

Used in: Retinal pigment epithelial detachment on trametinib

File provenance

Source: PubMed Central / U.S. National Library of Medicine. Retrieved 2026-10-28 Retrieved from the official PMC Open Access dataset. This stored copy may not include later source updates. No NLM endorsement.

SHA-256: e05bc2179d598671fa3806c9cc420bb3d4e32a5b080337898bf2bc74123d0aba

Fundus/OCT at presentation in an ocular-toxicity case with retinal fluid and inflammatory findings.
treatment example · Fig. 2

Fundus/OCT at presentation in an ocular-toxicity case with retinal fluid and inflammatory findings.

Original context: 53-year-old man with NSCLC receiving dabrafenib plus trametinib; concurrent uveitis/vitritis limits attribution to pure MEK retinopathy.

A mixed inflammatory/retinal-fluid phenotype, not an isolated pigment-epithelial detachment or branch retinal vein occlusion example.

Tarım Bilge, Kılıç Meltem. J Ophthalmic Inflamm Infect. 2023 Apr 12;13:17. doi: 10.1186/s12348-023-00339-0. Fig. 2.
Ocular side effects of Trametinib and Dabrafenib: a case report

Original figure & article ↗ · CC BY 4.0 ↗

None. Original figure, unmodified; all published panels and annotations retained.

Used in: Retinal pigment epithelial detachment on trametinib

File provenance

Source: PubMed Central / U.S. National Library of Medicine. Retrieved 2026-10-28 Retrieved from the official PMC Open Access dataset. This stored copy may not include later source updates. No NLM endorsement.

SHA-256: 4479e44e48f217b95179c078c25a055115559c6e8d42ea4003e5f76ddad1b0e7

Original CT series for olaparib-associated ILD, source case 1.
treatment example · Fig. 1

Original CT series for olaparib-associated ILD, source case 1.

Original context: Olaparib in the source oncology case series; CT appearance is nonspecific.

Original clinical figure reproduced unchanged for non-commercial educational use; serial panels count as one patient.

Brudon Alexandre, Fournier Dorine, Selle Frédéric et al.. BMC Pulm Med. 2024 Sep 13;24:448. doi: 10.1186/s12890-024-03276-3. Fig. 1.
Clinical and radiological pattern of olaparib-induced interstitial lung disease

Original figure & article ↗ · CC BY-NC-ND 4.0 ↗

None. Original figure, unmodified; all published panels and annotations retained.

Used in: Olaparib-associated ILD / pneumonitis

File provenance

Source: PubMed Central / U.S. National Library of Medicine. Retrieved 2026-10-28 Retrieved from the official PMC Open Access dataset. This stored copy may not include later source updates. No NLM endorsement.

SHA-256: 24d009f74f250c7dd41fd7a64213c3a4c51612ab0cf80087985bc786e87d1941

Original CT series for olaparib-associated ILD, source case 2.
treatment example · Fig. 2

Original CT series for olaparib-associated ILD, source case 2.

Original context: Olaparib in the source oncology case series; CT appearance is nonspecific.

Original clinical figure reproduced unchanged for non-commercial educational use; serial panels count as one patient.

Brudon Alexandre, Fournier Dorine, Selle Frédéric et al.. BMC Pulm Med. 2024 Sep 13;24:448. doi: 10.1186/s12890-024-03276-3. Fig. 2.
Clinical and radiological pattern of olaparib-induced interstitial lung disease

Original figure & article ↗ · CC BY-NC-ND 4.0 ↗

None. Original figure, unmodified; all published panels and annotations retained.

Used in: Olaparib-associated ILD / pneumonitis

File provenance

Source: PubMed Central / U.S. National Library of Medicine. Retrieved 2026-10-28 Retrieved from the official PMC Open Access dataset. This stored copy may not include later source updates. No NLM endorsement.

SHA-256: 4704c36d8954474e14b52dc48c1f4611ff661e57b0814ecdc685881c3d2e360f

Original CT series for olaparib-associated ILD, source case 3.
treatment example · Fig. 3

Original CT series for olaparib-associated ILD, source case 3.

Original context: Olaparib in the source oncology case series; CT appearance is nonspecific.

Original clinical figure reproduced unchanged for non-commercial educational use; serial panels count as one patient.

Brudon Alexandre, Fournier Dorine, Selle Frédéric et al.. BMC Pulm Med. 2024 Sep 13;24:448. doi: 10.1186/s12890-024-03276-3. Fig. 3.
Clinical and radiological pattern of olaparib-induced interstitial lung disease

Original figure & article ↗ · CC BY-NC-ND 4.0 ↗

None. Original figure, unmodified; all published panels and annotations retained.

Used in: Olaparib-associated ILD / pneumonitis

File provenance

Source: PubMed Central / U.S. National Library of Medicine. Retrieved 2026-10-28 Retrieved from the official PMC Open Access dataset. This stored copy may not include later source updates. No NLM endorsement.

SHA-256: b04da3a5e487a44989abec47932523ee265bc9c875399165292707ad5f365806

Serial CT abdominal-wall oedema in the source imatinib patient.
treatment example · Fig. 1

Serial CT abdominal-wall oedema in the source imatinib patient.

Original context: Imatinib in GIST; source case6.

Original clinical figure reproduced unchanged for non-commercial educational use; serial panels count as one patient.

Kim Kyung Won, Shinagare Atul B., Krajewski Katherine M. et al.. Korean J Radiol. 2015 Feb 27;16(2):304–13. doi: 10.3348/kjr.2015.16.2.304. Fig. 1.
Fluid Retention Associated with Imatinib Treatment in Patients with Gastrointestinal Stromal Tumor: Quantitative Radiologic Assessment and Implications for Management

Original figure & article ↗ · CC BY-NC 3.0 ↗

None. Original figure, unmodified; all published panels and annotations retained.

Used in: Imatinib-associated fluid retention

File provenance

Source: PubMed Central / U.S. National Library of Medicine. Retrieved 2026-10-28 Retrieved from the official PMC Open Access dataset. This stored copy may not include later source updates. No NLM endorsement.

SHA-256: fae629a7cde5e03b16430b4d8d51f64dbe928d03202b9696396023ce061bebb5

CT ascites, subcutaneous and scrotal oedema in a different source patient.
treatment example · Fig. 5

CT ascites, subcutaneous and scrotal oedema in a different source patient.

Original context: Imatinib in GIST; source case11.

Original clinical figure reproduced unchanged for non-commercial educational use; serial panels count as one patient.

Kim Kyung Won, Shinagare Atul B., Krajewski Katherine M. et al.. Korean J Radiol. 2015 Feb 27;16(2):304–13. doi: 10.3348/kjr.2015.16.2.304. Fig. 5.
Fluid Retention Associated with Imatinib Treatment in Patients with Gastrointestinal Stromal Tumor: Quantitative Radiologic Assessment and Implications for Management

Original figure & article ↗ · CC BY-NC 3.0 ↗

None. Original figure, unmodified; all published panels and annotations retained.

Used in: Imatinib-associated fluid retention

File provenance

Source: PubMed Central / U.S. National Library of Medicine. Retrieved 2026-10-28 Retrieved from the official PMC Open Access dataset. This stored copy may not include later source updates. No NLM endorsement.

SHA-256: 44dba45a34ce1476b2a5dde0879bb3dcd9f180ba146556d97c9969f114139134

Original clinical thoracic image from the pemetrexed-associated pneumonitis report.
treatment example · Figure 1

Original clinical thoracic image from the pemetrexed-associated pneumonitis report.

Original context: Pemetrexed in the stated cancer-treatment sequence; original case report.

Original clinical figure reproduced unchanged for non-commercial educational use; serial panels count as one patient.

Dhakal Binod, Singh Veerpal, Shrestha Anuj et al.. Clin Pract. 2011 Nov 8;1(4):e106. doi: 10.4081/cp.2011.e106. Figure 1.
Pemetrexed induced pneumonitis

Original figure & article ↗ · CC BY-NC 3.0 ↗

None. Original figure, unmodified; all published panels and annotations retained.

Used in: Pemetrexed-associated interstitial pneumonitis

File provenance

Source: PubMed Central / U.S. National Library of Medicine. Retrieved 2026-10-28 Retrieved from the official PMC Open Access dataset. This stored copy may not include later source updates. No NLM endorsement.

SHA-256: 974c0bbb9ca0e32a9a8a377026f0ca95658cae122d1c2774eec52b59c2ee7c93

Original MRI example of ICANS after CD19 CAR-T, figure 1.
treatment example · Figure 1.

Original MRI example of ICANS after CD19 CAR-T, figure 1.

Original context: CD19-directed CAR-T in the stated B-cell lymphoma context; product not specified.

Both figures provide genuine clinical MRI. Independent identity linkage between all source panels is not established here, so they are conservatively counted as one source-patient group rather than inflating the count.

Lasocki Arian, Harrison Simon J., Dickinson Michael et al.. Ther Adv Neurol Disord. 2026 Jan 12;19:17562864251404464. doi: 10.1177/17562864251404464. Figure 1..
The role of neuroimaging in neurotoxicity after chimeric antigen receptor T-cell therapy

Original figure & article ↗ · CC BY-NC 4.0 ↗

None. Original figure, unmodified; all published panels and annotations retained.

Used in: ICANS after CAR-T: a normal MRI does not exclude it

File provenance

Source: PubMed Central / U.S. National Library of Medicine. Retrieved 2026-10-28 Retrieved from the official PMC Open Access dataset. This stored copy may not include later source updates. No NLM endorsement.

SHA-256: 3c490a006b33e929af5696364d57a50a699474ea1d51188ae8ce0a4ecb94d660

Original MRI example of ICANS after CD19 CAR-T, figure 2.
treatment example · Figure 2.

Original MRI example of ICANS after CD19 CAR-T, figure 2.

Original context: CD19-directed CAR-T in the stated B-cell lymphoma context; product not specified.

Both figures provide genuine clinical MRI. Independent identity linkage between all source panels is not established here, so they are conservatively counted as one source-patient group rather than inflating the count.

Lasocki Arian, Harrison Simon J., Dickinson Michael et al.. Ther Adv Neurol Disord. 2026 Jan 12;19:17562864251404464. doi: 10.1177/17562864251404464. Figure 2..
The role of neuroimaging in neurotoxicity after chimeric antigen receptor T-cell therapy

Original figure & article ↗ · CC BY-NC 4.0 ↗

None. Original figure, unmodified; all published panels and annotations retained.

Used in: ICANS after CAR-T: a normal MRI does not exclude it

File provenance

Source: PubMed Central / U.S. National Library of Medicine. Retrieved 2026-10-28 Retrieved from the official PMC Open Access dataset. This stored copy may not include later source updates. No NLM endorsement.

SHA-256: 6f64c49efa41c9ed21564b48862aa940847c87099943f34091ad216d2802e7f0

Initial MRI in a reported ifosfamide encephalopathy case: right frontal subcortical T2/FLAIR and diffusion abnormalities without enhancement. This uncommon abnormal scan does not define the usual syndrome.
treatment example · Figure 2.

Initial MRI in a reported ifosfamide encephalopathy case: right frontal subcortical T2/FLAIR and diffusion abnormalities without enhancement. This uncommon abnormal scan does not define the usual syndrome.

Original context: Ifosfamide-containing chemotherapy in the published paediatric case; attribution is the source authors’ clinical assessment.

Original unmodified clinical figure. MRI may be normal or nonspecific; the two papers describe different patients, and serial views do not count as extra cases.

Ali Mohamed Daoud, Semedo Arthur, Adeyemi Boris et al.. Glob Pediatr Health. 2021 Jul 14;8:2333794X211030415. doi: 10.1177/2333794X211030415. Figure 2..
Reversible Encepahlopathy Induced by Ifosfamide with Brain Imaging

Original figure & article ↗ · CC BY-NC 4.0 ↗

None. Original figure, unmodified; all published panels and annotations retained.

Used in: Ifosfamide-associated encephalopathy

File provenance

Source: PubMed Central / U.S. National Library of Medicine. Retrieved 2026-10-28 Retrieved from the official PMC Open Access dataset. This stored copy may not include later source updates. No NLM endorsement.

SHA-256: 11f070c63a3814ac8e428747b9b1b9c9c80ae394edcb582d9236637a4d5405aa

Normal head MRI during a reported ifosfamide-induced encephalopathy episode: diffusion-weighted and T2-weighted images. A normal MRI does not exclude this clinical diagnosis.
treatment example · Figure 2

Normal head MRI during a reported ifosfamide-induced encephalopathy episode: diffusion-weighted and T2-weighted images. A normal MRI does not exclude this clinical diagnosis.

Original context: Ifosfamide-containing chemotherapy in the published paediatric case; attribution is the source authors’ clinical assessment.

Original unmodified clinical figure. MRI may be normal or nonspecific; the two papers describe different patients, and serial views do not count as extra cases.

Furui Yu, Komori Kazutoshi, Kurata Takashi et al.. Cureus. 2023 Jun 10;15(6):e40213. doi: 10.7759/cureus.40213. Figure 2.
Ifosfamide-Induced Encephalopathy Successfully Prevented by Methylene Blue: A Pediatric Case Report and Review of the Literature

Original figure & article ↗ · CC BY 3.0 ↗

None. Original figure, unmodified; all published panels and annotations retained.

Used in: Ifosfamide-associated encephalopathy

File provenance

Source: PubMed Central / U.S. National Library of Medicine. Retrieved 2026-10-28 Retrieved from the official PMC Open Access dataset. This stored copy may not include later source updates. No NLM endorsement.

SHA-256: 024b6e8ca92d3e48d98749da0f5912d47e834ec3d6e116acd9474a80899778e7

CT organising-pneumonia pattern in the published atezolizumab case.
treatment example · Fig. 1

CT organising-pneumonia pattern in the published atezolizumab case.

Original context: Atezolizumab in small-cell lung cancer.

Original published case illustration. It does not establish causality or diagnostic specificity in another patient.

Gosangi Babina, McIntosh Lacey, Keraliya Abhishek et al.. Eur J Radiol Open. 2022 Aug 8;9:100434. doi: 10.1016/j.ejro.2022.100434. Fig. 1.
Imaging features of toxicities associated with immune checkpoint inhibitors

Original figure & article ↗ · CC BY 4.0 ↗

None. Original figure, unmodified; all published panels and annotations retained.

Used in: Immune-mediated pneumonitis across checkpoint therapies

File provenance

Source: PubMed Central / U.S. National Library of Medicine. Retrieved 2026-10-28 Retrieved from the official PMC Open Access dataset. This stored copy may not include later source updates. No NLM endorsement.

SHA-256: 190cad710d02df865990db562da579523d6028082e130d71dc6f91b10fbaa409

DOTATOC-PET/CT showing paraspinal muscle inflammation in the source case.
treatment example · Figure 6

DOTATOC-PET/CT showing paraspinal muscle inflammation in the source case.

Original context: Ipilimumab plus nivolumab in a 61-year-old man; combination exposure.

Original published case illustration. It does not establish causality or diagnostic specificity in another patient.

Berz Antonia M., Boughdad Sarah, Vietti-Violi Naïk et al.. Front Immunol. 2023 Feb 23;14:1133207. doi: 10.3389/fimmu.2023.1133207. Figure 6.
Imaging assessment of toxicity related to immune checkpoint inhibitors

Original figure & article ↗ · CC BY 4.0 ↗

None. Original figure, unmodified; all published panels and annotations retained.

Used in: Checkpoint-associated myositis

File provenance

Source: PubMed Central / U.S. National Library of Medicine. Retrieved 2026-10-28 Retrieved from the official PMC Open Access dataset. This stored copy may not include later source updates. No NLM endorsement.

SHA-256: 9c195f7354b61e73086d66148c03db2a7342379e19a2364b2297285702244df7

Orbital MRI with right medial extraocular-muscle inflammation and interval imaging of the same patient.
treatment example · Figure 7

Orbital MRI with right medial extraocular-muscle inflammation and interval imaging of the same patient.

Original context: Ipilimumab plus nivolumab in melanoma; one patient, multiple examinations.

Original published case illustration. It does not establish causality or diagnostic specificity in another patient.

Berz Antonia M., Boughdad Sarah, Vietti-Violi Naïk et al.. Front Immunol. 2023 Feb 23;14:1133207. doi: 10.3389/fimmu.2023.1133207. Figure 7.
Imaging assessment of toxicity related to immune checkpoint inhibitors

Original figure & article ↗ · CC BY 4.0 ↗

None. Original figure, unmodified; all published panels and annotations retained.

Used in: Checkpoint-associated orbital myositis

File provenance

Source: PubMed Central / U.S. National Library of Medicine. Retrieved 2026-10-28 Retrieved from the official PMC Open Access dataset. This stored copy may not include later source updates. No NLM endorsement.

SHA-256: 4bd3d64a57d99a545adb5cf1550c0b2eda341af7e59597f1d5a8e102d5e9c52f

Brain MRI before therapy and at presentation with meningeal thickening; one source patient.
treatment example · Figure 8

Brain MRI before therapy and at presentation with meningeal thickening; one source patient.

Original context: Ipilimumab plus nivolumab in NSCLC; alternative infectious and malignant causes require exclusion.

Original published case illustration. It does not establish causality or diagnostic specificity in another patient.

Berz Antonia M., Boughdad Sarah, Vietti-Violi Naïk et al.. Front Immunol. 2023 Feb 23;14:1133207. doi: 10.3389/fimmu.2023.1133207. Figure 8.
Imaging assessment of toxicity related to immune checkpoint inhibitors

Original figure & article ↗ · CC BY 4.0 ↗

None. Original figure, unmodified; all published panels and annotations retained.

Used in: Checkpoint-associated aseptic meningitis

File provenance

Source: PubMed Central / U.S. National Library of Medicine. Retrieved 2026-10-28 Retrieved from the official PMC Open Access dataset. This stored copy may not include later source updates. No NLM endorsement.

SHA-256: a471a8c729288cf6b1d69e645f2c96a2d5e98cff16b56b6d6d86153fb103924c

CT showing a pericardial effusion in the published case.
treatment example · Fig. 6

CT showing a pericardial effusion in the published case.

Original context: Durvalumab in NSCLC; haemodynamic significance is a clinical/echocardiographic assessment.

Original published case illustration. It does not establish causality or diagnostic specificity in another patient.

Gosangi Babina, McIntosh Lacey, Keraliya Abhishek et al.. Eur J Radiol Open. 2022 Aug 8;9:100434. doi: 10.1016/j.ejro.2022.100434. Fig. 6.
Imaging features of toxicities associated with immune checkpoint inhibitors

Original figure & article ↗ · CC BY 4.0 ↗

None. Original figure, unmodified; all published panels and annotations retained.

Used in: Checkpoint-associated pericarditis / pericardial effusion

File provenance

Source: PubMed Central / U.S. National Library of Medicine. Retrieved 2026-10-28 Retrieved from the official PMC Open Access dataset. This stored copy may not include later source updates. No NLM endorsement.

SHA-256: 374170fdf03e61c34cfe19fa0d58f53c82940721f19ace49d5f9f4d8ae551f11

CT and PET/CT gallbladder inflammation in one patient.
treatment example · Fig. 12

CT and PET/CT gallbladder inflammation in one patient.

Original context: Pembrolizumab in tonsillar squamous-cell cancer.

Original published case illustration. It does not establish causality or diagnostic specificity in another patient.

Gosangi Babina, McIntosh Lacey, Keraliya Abhishek et al.. Eur J Radiol Open. 2022 Aug 8;9:100434. doi: 10.1016/j.ejro.2022.100434. Fig. 12.
Imaging features of toxicities associated with immune checkpoint inhibitors

Original figure & article ↗ · CC BY 4.0 ↗

None. Original figure, unmodified; all published panels and annotations retained.

Used in: Checkpoint-associated cholecystitis

File provenance

Source: PubMed Central / U.S. National Library of Medicine. Retrieved 2026-10-28 Retrieved from the official PMC Open Access dataset. This stored copy may not include later source updates. No NLM endorsement.

SHA-256: 5828ffe1e878cb9bee40b62123f5374c54bcbf493e1d9562b8f964f9b689dbb1

New adrenal FDG uptake and smooth adrenal enlargement in the published case.
treatment example · Fig. 15

New adrenal FDG uptake and smooth adrenal enlargement in the published case.

Original context: Pembrolizumab in melanoma.

Original published case illustration. It does not establish causality or diagnostic specificity in another patient.

Gosangi Babina, McIntosh Lacey, Keraliya Abhishek et al.. Eur J Radiol Open. 2022 Aug 8;9:100434. doi: 10.1016/j.ejro.2022.100434. Fig. 15.
Imaging features of toxicities associated with immune checkpoint inhibitors

Original figure & article ↗ · CC BY 4.0 ↗

None. Original figure, unmodified; all published panels and annotations retained.

Used in: Checkpoint-associated adrenalitis

File provenance

Source: PubMed Central / U.S. National Library of Medicine. Retrieved 2026-10-28 Retrieved from the official PMC Open Access dataset. This stored copy may not include later source updates. No NLM endorsement.

SHA-256: e3fcfff3be4beae5ba4953c69a962d44166558f0ad34afb7f75c4ff46a29133a

PET/CT inflammatory joint uptake and adrenal uptake in one patient.
treatment example · Fig. 16

PET/CT inflammatory joint uptake and adrenal uptake in one patient.

Original context: Pembrolizumab in melanoma; one patient with more than one immune-related finding.

Original published case illustration. It does not establish causality or diagnostic specificity in another patient.

Gosangi Babina, McIntosh Lacey, Keraliya Abhishek et al.. Eur J Radiol Open. 2022 Aug 8;9:100434. doi: 10.1016/j.ejro.2022.100434. Fig. 16.
Imaging features of toxicities associated with immune checkpoint inhibitors

Original figure & article ↗ · CC BY 4.0 ↗

None. Original figure, unmodified; all published panels and annotations retained.

Used in: Checkpoint-associated adrenalitis · Checkpoint-associated inflammatory arthritis

File provenance

Source: PubMed Central / U.S. National Library of Medicine. Retrieved 2026-10-28 Retrieved from the official PMC Open Access dataset. This stored copy may not include later source updates. No NLM endorsement.

SHA-256: 7cbc7b167500fe345c31157d7b67eb38c8e0d2057ddaacebc719c7362263def1

Serial CT of one pomalidomide-exposed patient with lung injury.
treatment example · Figure 1.

Serial CT of one pomalidomide-exposed patient with lung injury.

Original context: Pomalidomide in the source myeloma regimen; same patient across serial panels.

Original published case illustration. It does not establish causality or diagnostic specificity in another patient.

Vivien Alexandre, Ancel Julien, Godet Sophie et al.. Medicine (Baltimore). 2023 Jan 13;102(2):e32473. doi: 10.1097/MD.0000000000032473. Figure 1..
Pomalidomide-induced lung injury: A case report

Original figure & article ↗ · CC BY 4.0 ↗

None. Original figure, unmodified; all published panels and annotations retained.

Used in: Pomalidomide-associated lung injury / pneumonitis

File provenance

Source: PubMed Central / U.S. National Library of Medicine. Retrieved 2026-10-28 Retrieved from the official PMC Open Access dataset. This stored copy may not include later source updates. No NLM endorsement.

SHA-256: f28b72f1c909c5743183811e87d5797f659fd67d9bf5255c057970b6b714d229

CT at diagnosis and follow-up in a pomalidomide eosinophilic-pneumonia case.
treatment example · Fig. 1

CT at diagnosis and follow-up in a pomalidomide eosinophilic-pneumonia case.

Original context: Pomalidomide-associated eosinophilic-pneumonia case; one patient.

Original published case illustration. It does not establish causality or diagnostic specificity in another patient.

Megevet Mathieu, Freitas Pereira Jessica, Vervier Jeanne et al.. BMC Pulm Med. 2026 Jun 20;26:388. doi: 10.1186/s12890-026-04438-1. Fig. 1.
Pomalidomide-induced acute eosinophilic pneumonia: a case report

Original figure & article ↗ · CC BY 4.0 ↗

None. Original figure, unmodified; all published panels and annotations retained.

Used in: Pomalidomide-associated lung injury / pneumonitis

File provenance

Source: PubMed Central / U.S. National Library of Medicine. Retrieved 2026-10-28 Retrieved from the official PMC Open Access dataset. This stored copy may not include later source updates. No NLM endorsement.

SHA-256: 659b4353145f1bb6bbc848b030668e1c27bf0b37fcab284f303790b997facac7

Bilateral ground-glass opacity and subpleural consolidation in the source case.
treatment example · Figure 1.

Bilateral ground-glass opacity and subpleural consolidation in the source case.

Original context: Capmatinib in MET exon14-altered lung adenocarcinoma; infection was a competing consideration.

Original published case illustration. It does not establish causality or diagnostic specificity in another patient.

Lee Bing-Jie, Chang Cheng-Yu. Oncol Lett. 2023 Sep 4;26(4):455. doi: 10.3892/ol.2023.14042. Figure 1..
Capmatinib‑associated interstitial lung disease in a patient with lung adenocarcinoma harboring a skipping mutation of mesenchymal‑epithelial transition exon 14: A case report

Original figure & article ↗ · CC BY-NC-ND 4.0 ↗

None. Original figure, unmodified; all published panels and annotations retained.

Used in: Capmatinib-associated lung injury / pneumonitis

File provenance

Source: PubMed Central / U.S. National Library of Medicine. Retrieved 2026-10-28 Retrieved from the official PMC Open Access dataset. This stored copy may not include later source updates. No NLM endorsement.

SHA-256: 3875eaed86e5df6ac9401bfb1a645569fcdb19e08ac8f5addbbe0e3cff1ffa1c

CT multifocal ground-glass opacities in the published cetuximab case.
treatment example · Figure 1

CT multifocal ground-glass opacities in the published cetuximab case.

Original context: Cetuximab in the stated cancer-treatment sequence; other exposures remain relevant.

Original published case illustration. It does not establish causality or diagnostic specificity in another patient.

Emehinola Oluwatosin, Ali Ruhma, Guron Gunwant et al.. Cureus. 2024 Oct 31;16(10):e72797. doi: 10.7759/cureus.72797. Figure 1.
Cetuximab-Induced Pneumonitis: An Overlooked Complication

Original figure & article ↗ · CC BY 4.0 ↗

None. Original figure, unmodified; all published panels and annotations retained.

Used in: Cetuximab-associated lung injury / pneumonitis

File provenance

Source: PubMed Central / U.S. National Library of Medicine. Retrieved 2026-10-28 Retrieved from the official PMC Open Access dataset. This stored copy may not include later source updates. No NLM endorsement.

SHA-256: 3578fbc80f3e6f7843e89f8572999175cb2b9e7741ae3a1863872a25ca49c783

Original composite with clinical timeline and radiographic findings for patient 1.
treatment example · Figure 1

Original composite with clinical timeline and radiographic findings for patient 1.

Original context: Amivantamab added to ongoing osimertinib; suspected contribution with other competing causes.

The source figure contains both a timeline and genuine clinical images. Its repeated views remain one patient; it does not isolate amivantamab causality.

DeWeerd Alexander J., Sun Elizabeth, Iams Wade T.. JTO Clin Res Rep. 2025 Feb 12;6(7):100805. doi: 10.1016/j.jtocrr.2025.100805. Figure 1.
Two Cases of Amivantamab-Induced Pneumonitis in Patients With NSCLC: Case Report

Original figure & article ↗ · CC BY-NC-ND 4.0 ↗

None. Original figure, unmodified; all published panels and annotations retained.

Used in: Amivantamab-associated lung injury / pneumonitis

File provenance

Source: PubMed Central / U.S. National Library of Medicine. Retrieved 2026-10-28 Retrieved from the official PMC Open Access dataset. This stored copy may not include later source updates. No NLM endorsement.

SHA-256: 41b193c5adf0eb78aa4b314d57ea2ff341adeaa16d19740fb3b469305f230649

Original composite with clinical timeline and radiographic findings for patient 2.
treatment example · Figure 2

Original composite with clinical timeline and radiographic findings for patient 2.

Original context: Amivantamab added to ongoing osimertinib; suspected contribution with other competing causes.

The source figure contains both a timeline and genuine clinical images. Its repeated views remain one patient; it does not isolate amivantamab causality.

DeWeerd Alexander J., Sun Elizabeth, Iams Wade T.. JTO Clin Res Rep. 2025 Feb 12;6(7):100805. doi: 10.1016/j.jtocrr.2025.100805. Figure 2.
Two Cases of Amivantamab-Induced Pneumonitis in Patients With NSCLC: Case Report

Original figure & article ↗ · CC BY-NC-ND 4.0 ↗

None. Original figure, unmodified; all published panels and annotations retained.

Used in: Amivantamab-associated lung injury / pneumonitis

File provenance

Source: PubMed Central / U.S. National Library of Medicine. Retrieved 2026-10-28 Retrieved from the official PMC Open Access dataset. This stored copy may not include later source updates. No NLM endorsement.

SHA-256: c5e04051b0ed9867de567b27143a8b755a62bc24dbd8a0990eb631173cfbf34d

New bilateral ground-glass lung opacity on CT in the source patient.
treatment example · FIGURE 1

New bilateral ground-glass lung opacity on CT in the source patient.

Original context: Prior atezolizumab followed by sotorasib; the sequence limits exclusive-agent attribution.

Original published case illustration. It does not establish causality or diagnostic specificity in another patient.

Takahashi Yuta, Tachi Hiroaki, Watanabe Ryo et al.. Respirol Case Rep. 2024 Jan 24;12(1):e01284. doi: 10.1002/rcr2.1284. FIGURE 1.
Drug‐induced lung injury in a patient treated with prior atezolizumab and subsequent sotorasib: A case report

Original figure & article ↗ · CC BY 4.0 ↗

None. Original figure, unmodified; all published panels and annotations retained.

Used in: Sotorasib-associated lung injury / pneumonitis

File provenance

Source: PubMed Central / U.S. National Library of Medicine. Retrieved 2026-10-28 Retrieved from the official PMC Open Access dataset. This stored copy may not include later source updates. No NLM endorsement.

SHA-256: 5afc4a696fd1450c3a9d13b3e8225a36bc53e2bdd971d315ef026b2e0ea6a2f0

CT ground-glass, consolidative and nodular opacities in the published case.
treatment example · Fig. 3

CT ground-glass, consolidative and nodular opacities in the published case.

Original context: Lenalidomide in multiple myeloma; clinical/infectious work-up remains part of attribution.

Original published case illustration. It does not establish causality or diagnostic specificity in another patient.

O’Meara Kyle T., Fansiwala Kush, Kathuria-Prakash Nikhita et al.. BMC Pulm Med. 2024 Jul 4;24:321. doi: 10.1186/s12890-024-03129-z. Fig. 3.
Acute hypoxic respiratory failure due to Lenalidomide-induced interstitial pneumonitis in a patient with multiple myeloma

Original figure & article ↗ · CC BY 4.0 ↗

None. Original figure, unmodified; all published panels and annotations retained.

Used in: Lenalidomide-associated lung injury / pneumonitis

File provenance

Source: PubMed Central / U.S. National Library of Medicine. Retrieved 2026-10-28 Retrieved from the official PMC Open Access dataset. This stored copy may not include later source updates. No NLM endorsement.

SHA-256: 6bc5e30116db5d5262323b85414077a211bfa074286c7276fd7689d26f6db5b1

Abdominal CT pancreatic swelling and peripancreatic inflammatory change.
treatment example · Figure 2

Abdominal CT pancreatic swelling and peripancreatic inflammatory change.

Original context: Brentuximab-exposed case with hypertriglyceridaemic pancreatitis.

Original published case illustration. It does not establish causality or diagnostic specificity in another patient.

Maradana Sandhya, Akella Padmastuti, Nalluru Swarna S et al.. Cureus. 2019 Jul 15;11(7):e5138. doi: 10.7759/cureus.5138. Figure 2.
Hypertriglyceridemia Induced Pancreatitis Due to Brentuximab Therapy: First Case Report

Original figure & article ↗ · CC BY 3.0 ↗

None. Original figure, unmodified; all published panels and annotations retained.

Used in: Pancreatitis reported during brentuximab vedotin

File provenance

Source: PubMed Central / U.S. National Library of Medicine. Retrieved 2026-10-28 Retrieved from the official PMC Open Access dataset. This stored copy may not include later source updates. No NLM endorsement.

SHA-256: e08556f158fb3c01f639175b74df8bbb7c638009add591f9743fcc447d3c24c9

Slit-lamp photographs in two explicitly different mirvetuximab-exposed patients.
treatment example · Figure 5

Slit-lamp photographs in two explicitly different mirvetuximab-exposed patients.

Original context: Mirvetuximab soravtansine; panels A and B are different representative patients.

Original published case illustration. It does not establish causality or diagnostic specificity in another patient.

De Dominicis Francesco, Giudiceandrea Andrea, Cocuzza Martina et al.. Diagnostics (Basel). 2026 Apr 7;16(7):1107. doi: 10.3390/diagnostics16071107. Figure 5.
Corneal Toxicity of Mirvetuximab Soravtansine: Multimodal Imaging Features and Implications for Ophthalmologic Management

Original figure & article ↗ · CC BY 4.0 ↗

None. Original figure, unmodified; all published panels and annotations retained.

Used in: Mirvetuximab-associated corneal epithelial toxicity

File provenance

Source: PubMed Central / U.S. National Library of Medicine. Retrieved 2026-10-28 Retrieved from the official PMC Open Access dataset. This stored copy may not include later source updates. No NLM endorsement.

SHA-256: b38507e3569e2957eee17786c4467769e131b5259a1e41d8a37fc7e804638c56

Anterior-segment OCT before and after mirvetuximab.
treatment example · Figure 2

Anterior-segment OCT before and after mirvetuximab.

Original context: Mirvetuximab soravtansine; source OCT example.

OCT/topographic examples are not independently linked to an additional distinct patient in the source, so the unresolved patient mapping is not counted again alongside the two explicitly identified photo cases.

De Dominicis Francesco, Giudiceandrea Andrea, Cocuzza Martina et al.. Diagnostics (Basel). 2026 Apr 7;16(7):1107. doi: 10.3390/diagnostics16071107. Figure 2.
Corneal Toxicity of Mirvetuximab Soravtansine: Multimodal Imaging Features and Implications for Ophthalmologic Management

Original figure & article ↗ · CC BY 4.0 ↗

None. Original figure, unmodified; all published panels and annotations retained.

Used in: Mirvetuximab-associated corneal epithelial toxicity

File provenance

Source: PubMed Central / U.S. National Library of Medicine. Retrieved 2026-10-28 Retrieved from the official PMC Open Access dataset. This stored copy may not include later source updates. No NLM endorsement.

SHA-256: bc7bc50530f28892a4b7bc6cecdcabd748c1961e7c6734ee4207421f8c5a880e

CT colonic wall thickening and oedema in the palbociclib case.
treatment example · Figure 1

CT colonic wall thickening and oedema in the palbociclib case.

Original context: Palbociclib-associated colopathy; CT cannot diagnose the histological apoptotic pattern.

Original published case illustration. It does not establish causality or diagnostic specificity in another patient.

Díaz-Couselo Fernando A., Flagel Santiago, Coliva Gisela et al.. Eur J Case Rep Intern Med. 2025 Oct 23;12(11):005853. doi: 10.12890/2025_005853. Figure 1.
Palbociclib-Induced Apoptotic Colopathy: A Case Report and Review of the Literature

Original figure & article ↗ · CC BY-NC-ND 4.0 ↗

None. Original figure, unmodified; all published panels and annotations retained.

Used in: Palbociclib-associated apoptotic colopathy

File provenance

Source: PubMed Central / U.S. National Library of Medicine. Retrieved 2026-10-28 Retrieved from the official PMC Open Access dataset. This stored copy may not include later source updates. No NLM endorsement.

SHA-256: f145f8cbcf696761f62dfff6ef1449188231787b129b0a273c8e144c0bbf2f92

Paired CT before and after development of ascites in one patient.
treatment example · Figure 1

Paired CT before and after development of ascites in one patient.

Original context: Selpercatinib; chylous nature established by fluid analysis, not CT alone.

Original published case illustration. It does not establish causality or diagnostic specificity in another patient.

Dias Adriana, Pereira Joao O, Madama Daniela. Cureus. 2025 Nov 2;17(11):e95944. doi: 10.7759/cureus.95944. Figure 1.
Chylous Ascites, a Rare Adverse Reaction to Selpercatinib

Original figure & article ↗ · CC BY 4.0 ↗

None. Original figure, unmodified; all published panels and annotations retained.

Used in: Chylous effusions during selpercatinib

File provenance

Source: PubMed Central / U.S. National Library of Medicine. Retrieved 2026-10-28 Retrieved from the official PMC Open Access dataset. This stored copy may not include later source updates. No NLM endorsement.

SHA-256: 436eefdf3dc70b8c139ed828fc8e4e4b0467400210dab85d7f79a881efb98a9d

Echocardiography showing pericardial effusion in the source patient.
treatment example · Figure 3

Echocardiography showing pericardial effusion in the source patient.

Original context: Selpercatinib in RET fusion-positive lung cancer; source case-level attribution.

Original published case illustration. It does not establish causality or diagnostic specificity in another patient.

Shiraishi Tomoko, Isoshima Yu, Tahara Masahiro et al.. Cureus. 2025 Jun 18;17(6):e86275. doi: 10.7759/cureus.86275. Figure 3.
A Case Report on Pericardial Effusion Associated With Selpercatinib in the First Patient With Rearranged During Transfection (RET) Fusion-Positive Lung Cancer

Original figure & article ↗ · CC BY 4.0 ↗

None. Original figure, unmodified; all published panels and annotations retained.

Used in: Pericardial effusion reported during selpercatinib

File provenance

Source: PubMed Central / U.S. National Library of Medicine. Retrieved 2026-10-28 Retrieved from the official PMC Open Access dataset. This stored copy may not include later source updates. No NLM endorsement.

SHA-256: a4b4d0fc434d994f15b237244fb4a85bafbddbc627298ce5826bb53b7ff187da

Angiography and vessel-wall MRI showing multifocal cerebral arterial disease.
pattern example · Fig. 1

Angiography and vessel-wall MRI showing multifocal cerebral arterial disease.

Original context: Sequential imatinib, nilotinib and prolonged ponatinib exposure, plus conventional vascular risk factors.

One sequential-TKI case. The images do not isolate nilotinib, ponatinib or a unique non-inflammatory drug mechanism.

Yang Jeong Eun, Jeon Jae Ho, Do Young Rok et al.. BMC Neurol. 2026 Jul 20;26:651. doi: 10.1186/s12883-026-05192-x. Fig. 1.
Tyrosine kinase inhibitor–associated cerebral vasculopathy with a distinct non-enhancing vessel wall phenotype: a case report

Original figure & article ↗ · CC BY 4.0 ↗

None. Original figure, unmodified; all published panels and annotations retained.

Used in: Nilotinib-associated arterial occlusive disease · Ponatinib-associated arterial occlusive disease

File provenance

Source: PubMed Central / U.S. National Library of Medicine. Retrieved 2026-10-28 Retrieved from the official PMC Open Access dataset. This stored copy may not include later source updates. No NLM endorsement.

SHA-256: 8643862ba813084281e6eb80682a528789db5f58fa8af47698bacfea84f5926b

Original brain-MRI composite after brexu-cel; panel D explicitly shows two different patients.
treatment example · Figure 2.

Original brain-MRI composite after brexu-cel; panel D explicitly shows two different patients.

Original context: Brexucabtagene autoleucel for mantle-cell lymphoma; ICANS clinical context.

All published panels retained unchanged. Two separate patients are established in ASL panel D; views in A/B and E/F are not counted again as additional unique patients.

Nie Esther H., Su Yi-Jiun, Baird John H. et al.. Blood Adv. 2024 Feb 2;8(6):1474–86. doi: 10.1182/bloodadvances.2023011896. Figure 2..
Clinical features of neurotoxicity after CD19 CAR T-cell therapy in mantle cell lymphoma

Original figure & article ↗ · CC BY-NC-ND 4.0 ↗

None. Original figure, unmodified; all published panels and annotations retained.

Used in: ICANS after brexucabtagene autoleucel

File provenance

Source: PubMed Central / U.S. National Library of Medicine. Retrieved 2026-10-28 Retrieved from the official PMC Open Access dataset. This stored copy may not include later source updates. No NLM endorsement.

SHA-256: c0dd7832ed34ecd502fe803e588aaf5813193004c9fab1f0c4fdcbdf99b3e0fa

Original portal image and CT of organising pneumonia beyond the irradiated field in one patient.
treatment example · Fig. 5

Original portal image and CT of organising pneumonia beyond the irradiated field in one patient.

Original context: Breast-conserving surgery and adjuvant breast radiotherapy.

Original published case illustration. It does not establish causality or diagnostic specificity in another patient.

Yamaguchi Ken, Egashira Ryoko, Nakazono Takahiko et al.. Breast Cancer. 2025 Dec 19;33(1):50–61. doi: 10.1007/s12282-025-01816-1. Fig. 5.
CT findings of lung injury during breast cancer treatment

Original figure & article ↗ · CC BY 4.0 ↗

None. Original figure, unmodified; all published panels and annotations retained.

Used in: Organising pneumonia after breast radiotherapy

File provenance

Source: PubMed Central / U.S. National Library of Medicine. Retrieved 2026-10-28 Retrieved from the official PMC Open Access dataset. This stored copy may not include later source updates. No NLM endorsement.

SHA-256: af229473a05bcbf6ce117c72381f904d81fd5843f9573201bad617f7b489de61

Original radiation-field image and HRCT demonstrating new field-conforming opacity after the systemic exposure.
treatment example · Fig. 6

Original radiation-field image and HRCT demonstrating new field-conforming opacity after the systemic exposure.

Original context: Thoracic radiotherapy followed by durvalumab in lung cancer.

Original published case illustration. It does not establish causality or diagnostic specificity in another patient.

Yamaguchi Ken, Egashira Ryoko, Nakazono Takahiko et al.. Breast Cancer. 2025 Dec 19;33(1):50–61. doi: 10.1007/s12282-025-01816-1. Fig. 6.
CT findings of lung injury during breast cancer treatment

Original figure & article ↗ · CC BY 4.0 ↗

None. Original figure, unmodified; all published panels and annotations retained.

Used in: Radiation-recall pneumonitis after systemic therapy

File provenance

Source: PubMed Central / U.S. National Library of Medicine. Retrieved 2026-10-28 Retrieved from the official PMC Open Access dataset. This stored copy may not include later source updates. No NLM endorsement.

SHA-256: 3bf5ba90389fc131a287b173a09a1b1c694f8a9dbc1b082365252f317d3460d9

Brain MRI shows posterior periventricular T2/DWI/FLAIR high signal without contrast enhancement in one patient with delayed progressive neurotoxicity.
treatment example · Figure 2

Brain MRI shows posterior periventricular T2/DWI/FLAIR high signal without contrast enhancement in one patient with delayed progressive neurotoxicity.

Original context: 55-year-old man with myelofibrosis after allogeneic HSCT; thiotepa/fludarabine/ATG conditioning, cyclosporine and short-course methotrexate prophylaxis.

Source case attributes the syndrome to fludarabine in a transplant regimen. MRI supports a white-matter injury pattern, without independently proving causality. All panels depict one patient.

Annaloro Claudio, Costa Antonella, Fracchiolla Nicola S et al.. Clin Case Rep. 2015 Jun 11;3(7):650–5. doi: 10.1002/ccr3.308. Figure 2.
Severe fludarabine neurotoxicity after reduced intensity conditioning regimen to allogeneic hematopoietic stem cell transplantation: a case report

Original figure & article ↗ · CC BY-NC 4.0 ↗

None. Original figure, unmodified; all published panels and annotations retained.

Used in: Delayed fludarabine neurotoxicity

File provenance

Source: PubMed Central / U.S. National Library of Medicine. Retrieved 2026-10-28 Retrieved from the official PMC Open Access dataset. This stored copy may not include later source updates. No NLM endorsement.

SHA-256: c044be7f66d9c61034323da61776a202e004986fd84b3c008250c10245a80a83

T2 brain MRI: A–C show white-matter, optic pathway and pontine lesions in case 1; D–F show white-matter, splenial and pontine lesions in case 2.
treatment example · Fig. 2

T2 brain MRI: A–C show white-matter, optic pathway and pontine lesions in case 1; D–F show white-matter, splenial and pontine lesions in case 2.

Original context: Case 1: 64-year-old woman, prior FLAG (fludarabine/cytarabine/G-CSF), IDAC and allo-PBSCT. Case 2: 63-year-old man, azacitidine then busulfan/fludarabine/ATG conditioning and allo-PBSCT.

Two fludarabine-exposed patients with autopsy-supported chemotherapy-related toxic leukoencephalopathy. Authors could not separate contributions of fludarabine, cytarabine or busulfan. Regimen-associated examples, not isolated proof of fludarabine toxicity.

Lim Ka Young, Kim Seong-Ik, Kim Hyunhee et al.. BMC Neurol. 2022 Aug 3;22:288. doi: 10.1186/s12883-022-02818-8. Fig. 2.
Toxic leukoencephalopathy with axonal spheroids caused by chemotherapeutic drugs other than methotrexate

Original figure & article ↗ · CC BY 4.0 ↗

None. Original figure, unmodified; all published panels and annotations retained.

Used in: Delayed fludarabine neurotoxicity

File provenance

Source: PubMed Central / U.S. National Library of Medicine. Retrieved 2026-10-28 Retrieved from the official PMC Open Access dataset. This stored copy may not include later source updates. No NLM endorsement.

SHA-256: 8d38d8668673760cbf62ee4c17ebd4bd16f55b5dddbbfe32ad009c9e3500ba42

Brain FDG PET/CT shows diffuse hypometabolism in frontal, parietal and temporal cortex and cerebellum in a patient with persistent ataxia; conventional MRI was unremarkable.
treatment example · Fig. 2

Brain FDG PET/CT shows diffuse hypometabolism in frontal, parietal and temporal cortex and cerebellum in a patient with persistent ataxia; conventional MRI was unremarkable.

Original context: 55-year-old man with Burkitt lymphoma after multiple regimens including rituximab/methotrexate/cytarabine, subsequent cytarabine-containing chemotherapy and intrathecal multidrug prophylaxis.

Regimen-associated cerebellar toxicity example. PET hypometabolism is nonspecific and does not establish cytarabine causality. Figures 1–3 in this article are one patient, not three cases.

Kim Hyoung Seop, Jung Chul Oh, Jeon Ha Ra et al.. Ann Rehabil Med. 2012 Aug 27;36(4):578–83. doi: 10.5535/arm.2012.36.4.578. Fig. 2.
Rehabilitation for Ataxia Following Chemotherapy for Burkitt Lymphoma Involving the Rectum

Original figure & article ↗ · CC BY-NC 3.0 ↗

None. Original figure, unmodified; all published panels and annotations retained.

Used in: High-dose cytarabine cerebellar toxicity

File provenance

Source: PubMed Central / U.S. National Library of Medicine. Retrieved 2026-10-28 Retrieved from the official PMC Open Access dataset. This stored copy may not include later source updates. No NLM endorsement.

SHA-256: 9696eff3a37e82e6a140a6d96593ed58e44ff9f1c6cd328bf67c35c126b030e4

Serial chest CT in one patient: A/C/E precede enasidenib; B/D/F show increased pericardial fluid and ground-glass opacities during the reported differentiation syndrome.
treatment example · Figure 2

Serial chest CT in one patient: A/C/E precede enasidenib; B/D/F show increased pericardial fluid and ground-glass opacities during the reported differentiation syndrome.

Original context: 54-year-old woman with metastatic ALK-rearranged, IDH2-mutant NSCLC; off-label enasidenib added to lorlatinib. Ground-glass change and pericardial effusion were already present before enasidenib.

Exposure-matched enasidenib report in a solid tumor; pre-existing abnormalities and lorlatinib coexposure limit attribution. Six panels represent one patient. CT is nonspecific.

Sukhadia Bhoomika, Tan Dean, Oh Youjin et al.. JTO Clin Res Rep. 2023 Apr 22;5(10):100520. doi: 10.1016/j.jtocrr.2023.100520. Figure 2.
Differentiation Syndrome in a Patient With NSCLC Harboring IDH2 Mutation Treated With Enasidenib: Case Report

Original figure & article ↗ · CC BY-NC-ND 4.0 ↗

None. Original figure, unmodified; all published panels and annotations retained.

Used in: Enasidenib-associated differentiation syndrome · Ivosidenib differentiation syndrome

File provenance

Source: PubMed Central / U.S. National Library of Medicine. Retrieved 2026-10-28 Retrieved from the official PMC Open Access dataset. This stored copy may not include later source updates. No NLM endorsement.

SHA-256: 799e71c9953041276506bc92677edf3ad7cf823d37e2bff1480101c94b1177ec

Mixed original figure: A is a skin photograph; B is the clinical chest radiograph showing bilateral diffuse interstitial infiltrates without cardiomegaly. One patient.
treatment example · FIGURE 1

Mixed original figure: A is a skin photograph; B is the clinical chest radiograph showing bilateral diffuse interstitial infiltrates without cardiomegaly. One patient.

Original context: 65-year-old woman with AML receiving enasidenib and unspecified standard leukemia therapy; authors reported Sweet syndrome with differentiation syndrome.

Only panel B is radiologic and relevant to pulmonary imaging. The whole mixed figure must remain unmodified under the ND license; the skin photograph does not add an imaging case.

Mohamed Amr. Clin Case Rep. 2021 May 19;9(5):e04099. doi: 10.1002/ccr3.4099. FIGURE 1.
Enasidenib‐induced Sweet syndrome with differentiation syndrome

Original figure & article ↗ · CC BY-NC-ND 4.0 ↗

None. Original figure, unmodified; all published panels and annotations retained.

Used in: Enasidenib-associated differentiation syndrome · Ivosidenib differentiation syndrome

File provenance

Source: PubMed Central / U.S. National Library of Medicine. Retrieved 2026-10-28 Retrieved from the official PMC Open Access dataset. This stored copy may not include later source updates. No NLM endorsement.

SHA-256: 22b3c87da15142fa55825cf3555e3a3c378d1fb9ea0588934303c02de134e8b2

Original sagittal T1-weighted marrow MRI in a source patient with MDS, historical RA subtype.
pattern example · Figure 3.

Original sagittal T1-weighted marrow MRI in a source patient with MDS, historical RA subtype.

Original context: General MDS study; this is not an olaparib-exposed patient or proof of treatment-related MDS/AML.

General MDS marrow appearance only. Historical classification and transfusional iron/cellularity confounders apply; MRI cannot establish drug causality or replace haematologic diagnosis. Figures 3/4 and 5/6 are paired views of two patients; only one view of each is shown here.

Kwiatkowska-Pamuła A, Ziółko E, Muc-Wierzgoń M et al. Pol J Radiol. 2013;78(1):42–49. doi:10.12659/PJR.883766. Figure 3. © Pol J Radiol, 2013.
Usefulness of spinal magnetic resonance imaging in patients with myelodysplastic syndromes

Original figure & article ↗ · Explicit non-commercial reuse grant ↗

None. Original published figure, unmodified.

Used in: MDS / AML risk during olaparib exposure

File provenance

Source: PubMed Central / U.S. National Library of Medicine. Retrieved 2026-10-29 Original figure downloaded directly from the image link in the PMC article; article-level non-commercial grant checked. This stored copy may not include later source updates. No NLM endorsement.

SHA-256: 4395ddfcfac186f2c31a9afacbb9e04b0e80e6e4938e4b3c5958d0e500db373b

Original sagittal T1-weighted marrow MRI in a source patient with MDS, historical RAEB II subtype.
pattern example · Figure 5.

Original sagittal T1-weighted marrow MRI in a source patient with MDS, historical RAEB II subtype.

Original context: General MDS study; this is not an olaparib-exposed patient or proof of treatment-related MDS/AML.

General MDS marrow appearance only. Historical classification and transfusional iron/cellularity confounders apply; MRI cannot establish drug causality or replace haematologic diagnosis. Figures 3/4 and 5/6 are paired views of two patients; only one view of each is shown here.

Kwiatkowska-Pamuła A, Ziółko E, Muc-Wierzgoń M et al. Pol J Radiol. 2013;78(1):42–49. doi:10.12659/PJR.883766. Figure 5. © Pol J Radiol, 2013.
Usefulness of spinal magnetic resonance imaging in patients with myelodysplastic syndromes

Original figure & article ↗ · Explicit non-commercial reuse grant ↗

None. Original published figure, unmodified.

Used in: MDS / AML risk during olaparib exposure

File provenance

Source: PubMed Central / U.S. National Library of Medicine. Retrieved 2026-10-29 Original figure downloaded directly from the image link in the PMC article; article-level non-commercial grant checked. This stored copy may not include later source updates. No NLM endorsement.

SHA-256: 6d55a7edba52516029909dc997189d7ab54b2632f28ceea73ca962ba1c9512fe

Original brain CT/MRI composite shows no reported hemorrhage or white/gray-matter abnormality during clinically reported ifosfamide encephalopathy. One patient.
treatment example · Figure 1

Original brain CT/MRI composite shows no reported hemorrhage or white/gray-matter abnormality during clinically reported ifosfamide encephalopathy. One patient.

Original context: 4-year-old girl with relapsed Wilms tumor and severe renal impairment; adjusted ICE comprising ifosfamide/etoposide with mesna, carboplatin omitted.

Normal structural imaging is a limitation example, not exclusion of encephalopathy or diagnostic proof. Multiple planes/modalities depict one patient.

Latifi A, Yousefian S, Azimi S. J Compr Ped. 2024;15(4):e153676. doi:10.5812/jcp-153676. Figure 1. © 2024 Latifi et al. CC BY 4.0.
Ifosfamide-Induced Encephalopathy Managed Successfully with Methylene Blue in a Child with Wilms Tumor: A Case Report and Review of the Literature

Original figure & article ↗ · CC BY 4.0 ↗

None. Whole original published figure, unmodified.

Used in: Ifosfamide-associated encephalopathy

File provenance

Source: Original journal publisher: Brieflands / Journal of Comprehensive Pediatrics. Retrieved 2026-10-29 Original figure from the journal publisher; the saved article contains the figure link and CC BY grant. This stored copy may not include later source updates. No NLM endorsement.

SHA-256: 2435470b791d9938948087193f2035506b499047f153df9eb23ac82071cf569a

Scope & evidence ↗